Solana: Seeking buying opportunities? Consider these levels
Here's how Solana could offer new buying opportunities based on BTC's price actions.

Disclaimer: The information presented does not constitute financial, investment, trading, or other types of advice and is solely the writer’s opinion.
- SOL’s 4-hour timeframe was bearish at the time of writing.
- The token’s buying volumes declined at the range-high of $16.11.
Solana [SOL] has been constricted in a range formation since 10 June. The corrective bounce from the $14.4 range low from 16 June received a double boost. The initial boost was from Bitcoin’s [BTC] upswing and, second, Solana’s impressive NFT performance.
Is your portfolio green? Check out the SOL Profit Calculator
But the price action has hit the range-high of $16.11 at the time of writing. On the other hand, BTC focused on $27k, but if bulls falter, SOL could retrace to these levels.
Can bulls clear the range-high hurdle?
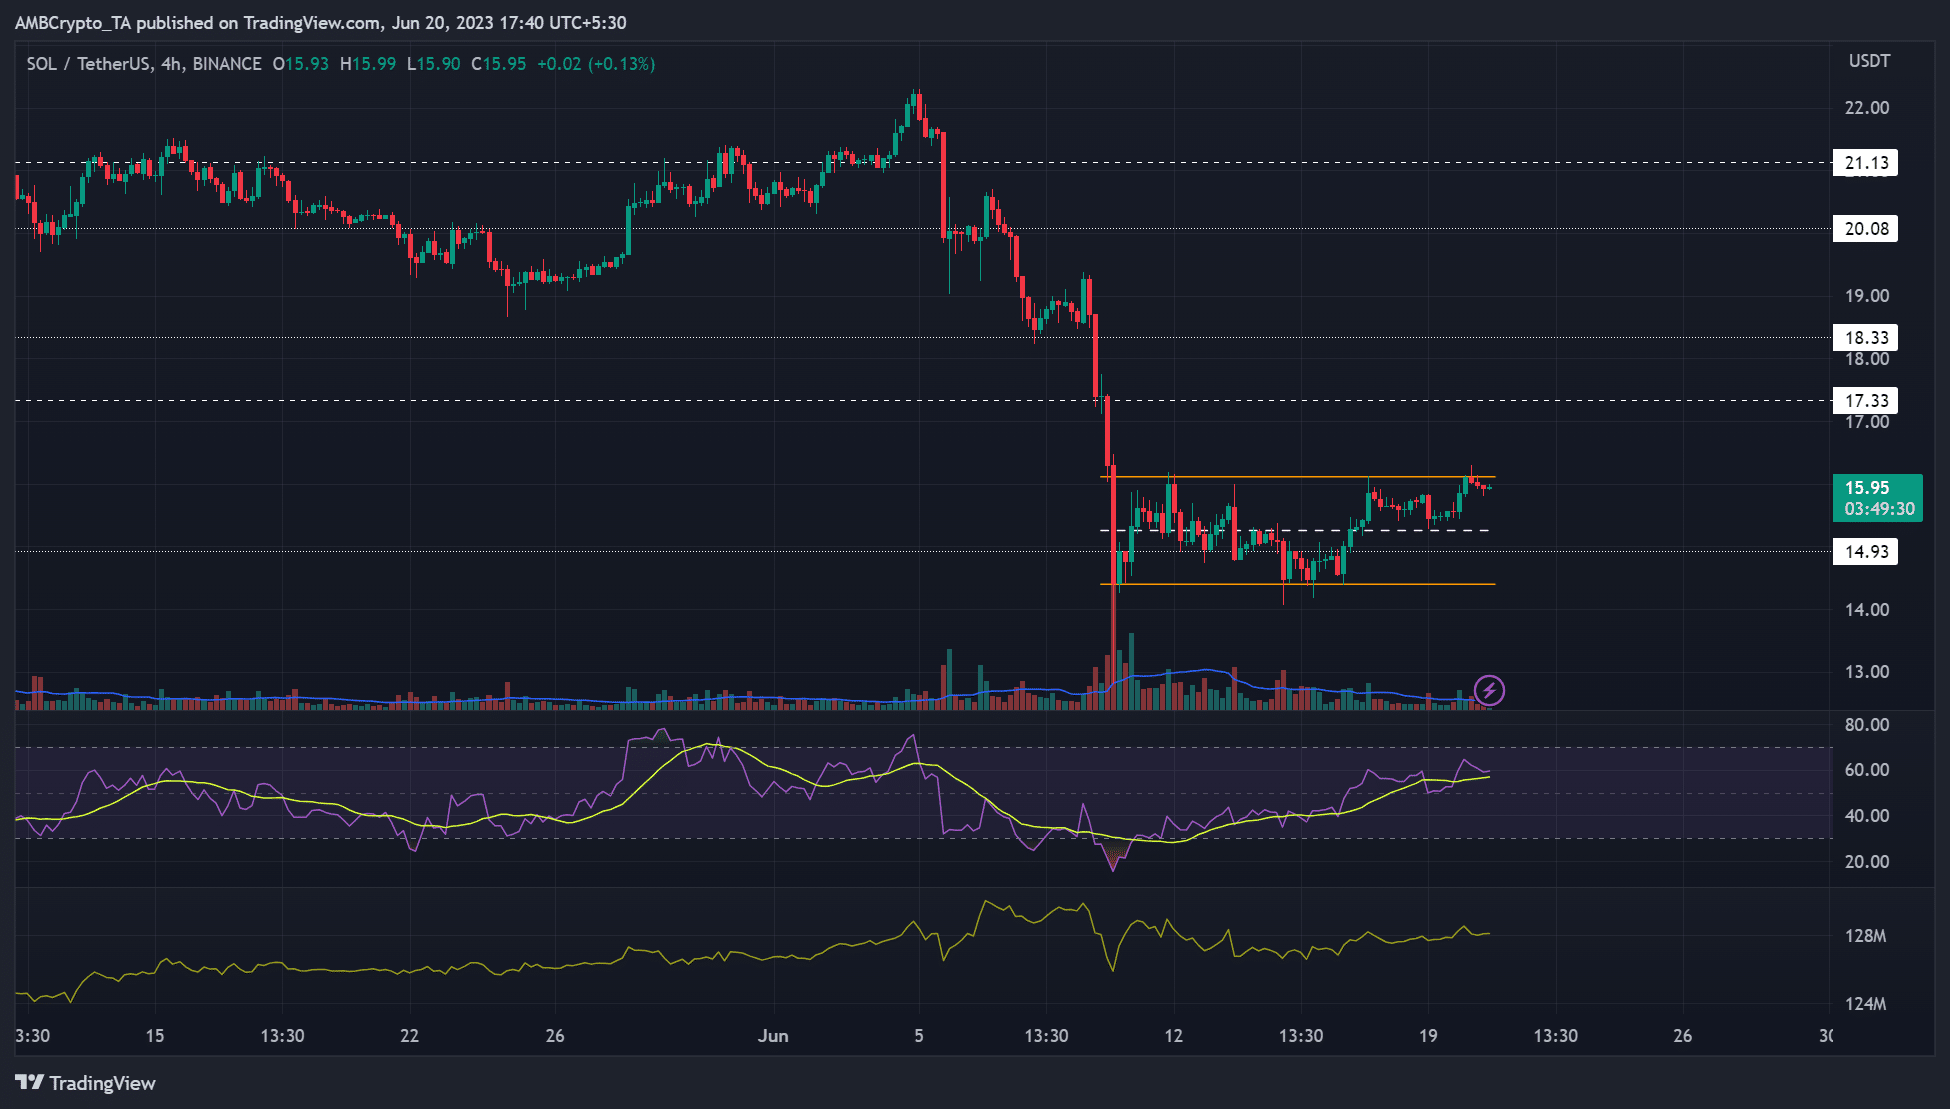
The RSI (Relative Strength Index) was above the 50-mark at press time but registered a downtick. It showed recent buying pressure eased after SOL hit the range-high of $16.11. Similarly, the Accumulation/Distribution retraced slightly, showing a pause in accumulation.
If BTC cannot cross $27k, SOL could retrace to the mid-range of $15.24 or range low of $14.4. Notably, the mid-range had rescued the bulls once before. Below lies a key resistance level of November/December 2022, at $14.93.
So, a likely rebound from the $14.93 – $15.24 could offer a new buying opportunity. Alternatively, a retest on the breakout level at the range-high of $16.11, especially if BTC crosses $27k, could offer secondary buying opportunities, targeting $17.33 (near the March swing low).
Buying volumes eased
How much are 1,10,100 SOLs worth today?
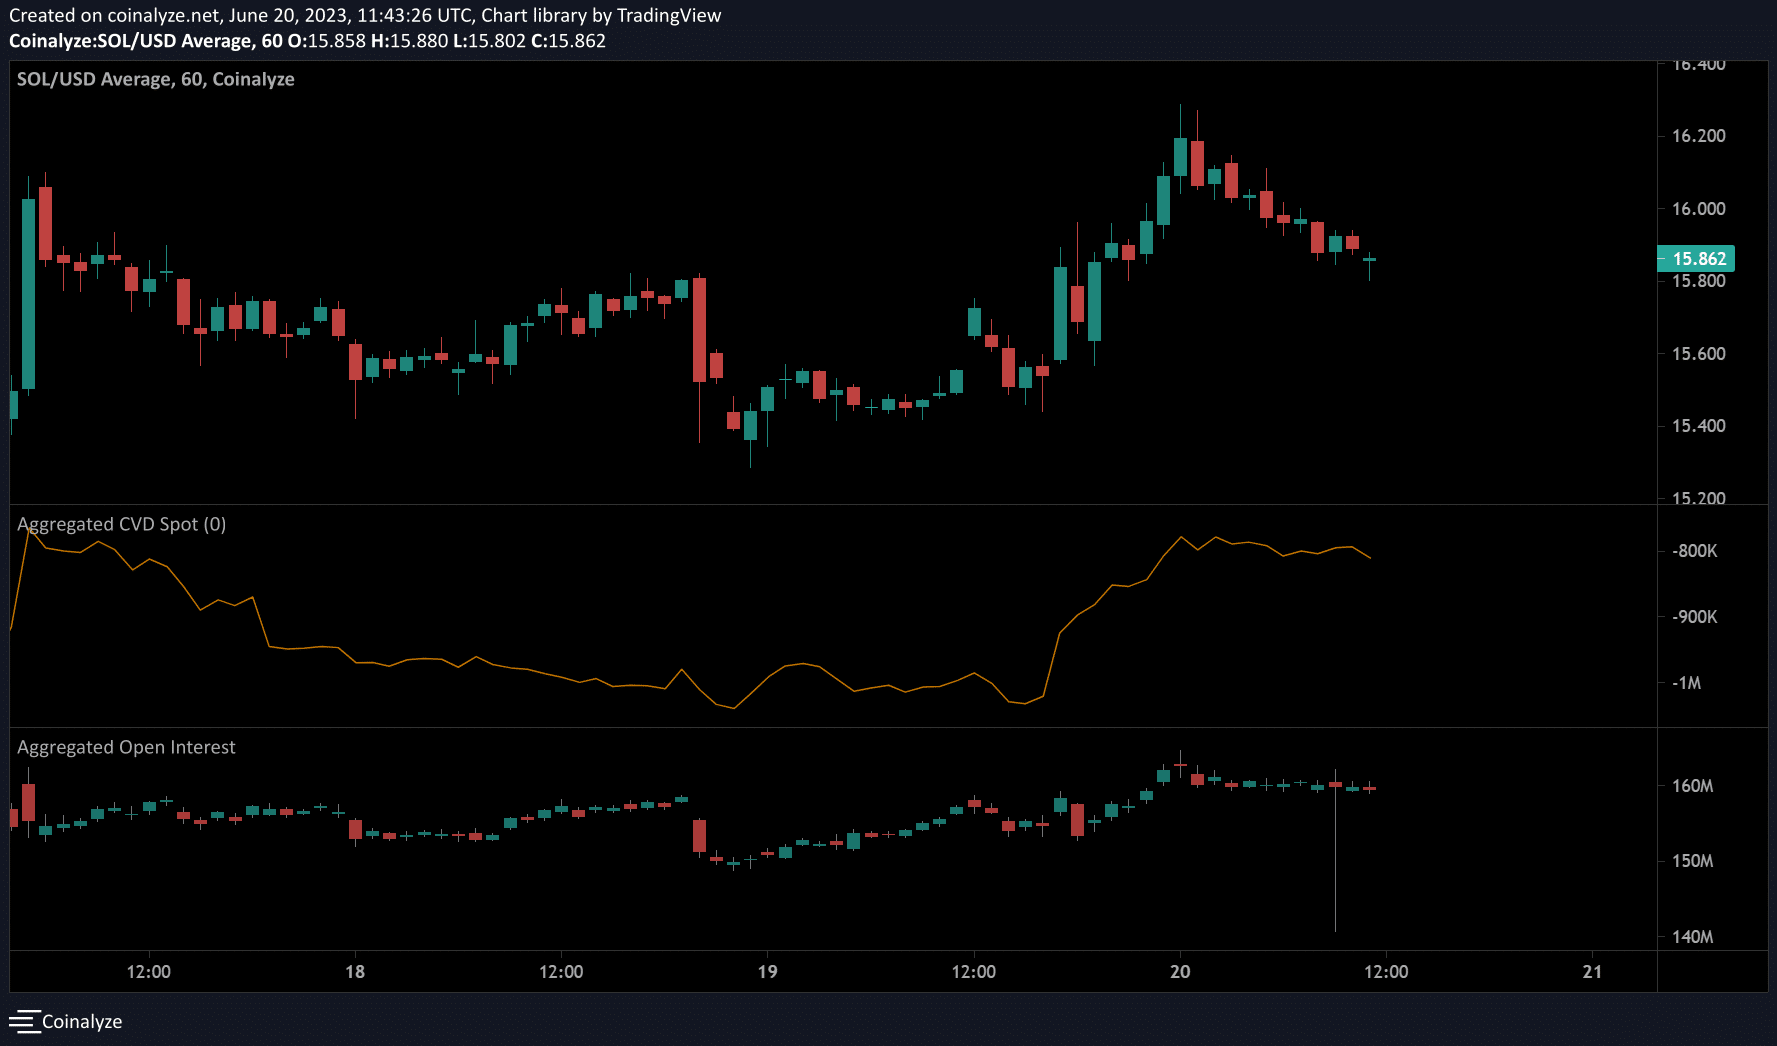
The CVD (Cumulative Volume Delta), which tracks buying and selling volumes and overall sentiment, improved on the 1-hour chart from 18 June. But the metric moved sideways at press time, indicating buying pressure eased.
Similarly, the open interest (OI) rates fluctuated narrowly below $160 million. A decline in the OI will indicate increasing bearish sentiment and likely retest of the mid-range level of $14.93 – $15.24. But a bullish BTC (above $27k) will invalidate the thesis.