- Solana was experiencing a slowdown in network activity which may impact demand for SOL.
- SOL struggles to maintain above $160 after its recent bullish recovery.
Solana [SOL] has generally experienced a significant slowdown in network activity so far in August. An outcome that is particularly evident in the network’s on-chain revenue which slowed down considerably in the last four weeks.
On-chain data from DeFiLlama revealed that daily revenue on the Solana network is down to 5-month lows. The last time that its revenue figures were this low was in March.
For context, the network generated $234,000 in on-chain revenue in the last 24 hours.
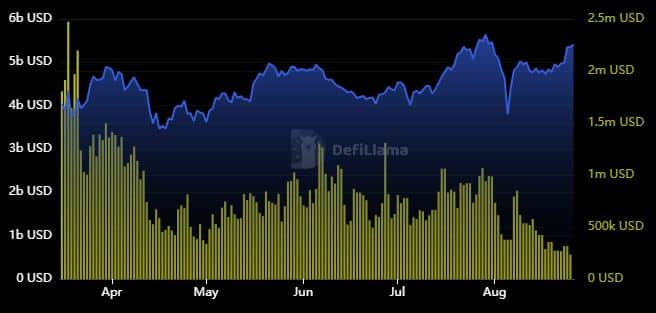
Source: DeFiLlama
Solana managed over $500,000 in daily revenue in the last 5 months. In most cases it even surpassed the $1 million mark. A testament to the network’s robust demand that we observed since the start of the year.
Despite the revenue shortfalls, Solana’s total value locked (TVL) continued recovering from the dip that occurred earlier this month. This may indicate a return of investor confidence.
However, the declining revenue reflects the state of the Solana network in terms of utility.
Transactions on the Solana network cooled down in the last 4 weeks. It averaged over 42 million transactions every day in the last week of July. However, the number of daily transactions declined below 40 million transactions in August.
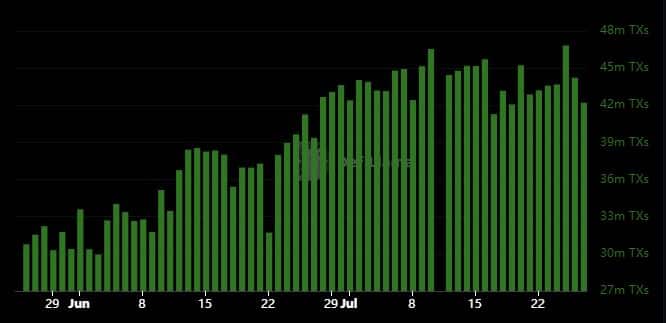
Source: DeFiLlama
The network registered 32.8 million transactions in the last 24 hours at the time of writing. Daily transactions dropped below 35 million transactions in the last 2 days. Despite this, the network’s on-chain volumes have flashed recovery signs.
Daily token volume bounced back above $ billion in the last two days. It previously slowed down below that level last week as the market experienced a phase of uncertainty and low activity.
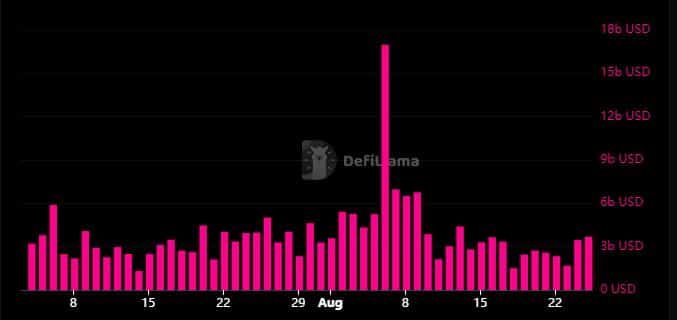
Source: DeFiLlama
But what does this all mean for SOL demand? Technically, lower transactions and revenue confirm declining network activity. This should also be consistent with lower demand for SOL on the network.
However, the demand for SOL in exchanges saw a bit of a boost last week largely driven by a wave of positive sentiment triggered by expectations of rate cuts.
SOL briefly managed to push above the $160 price range during the weekend. It exchanged hands at $159.16 at press time, after the bulls seemed to take a break within the current price level.
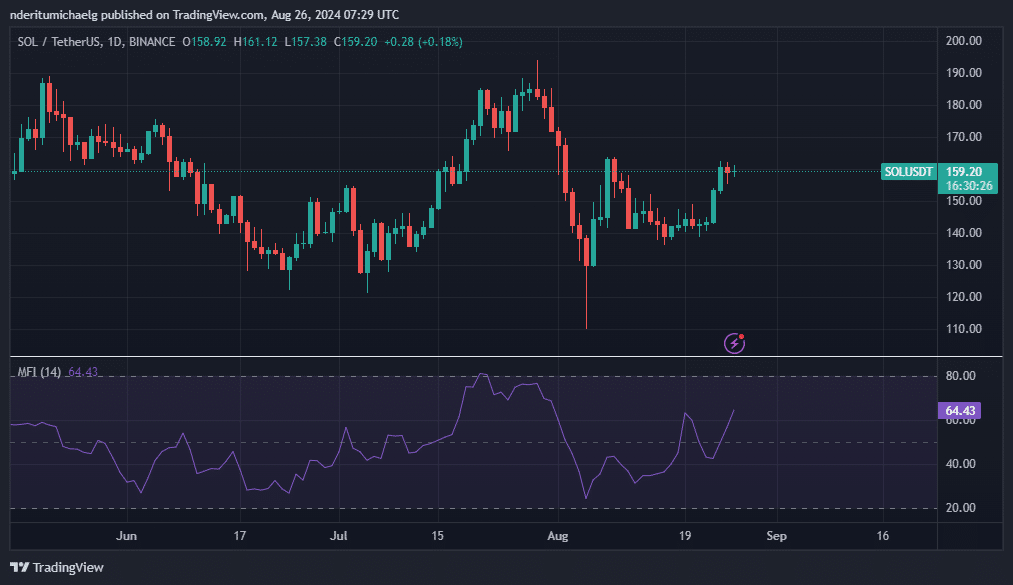
Source: TradingView
Is your portfolio green? Check the Solana Profit Calculator
SOL’s money flow indicator confirmed that it has been receiving positive money flow in the last few days. One of the most notable potential impacts of the slowing activity in Solana network is that SOL’s bounce back might be limited.
Periods of heavy utility demonstrated sharp bounce backs in the recent past.