Solana [SOL] breaks past $20 mark, watch out for a dip into this region

Disclaimer: The information presented does not constitute financial, investment, trading, or other types of advice and is solely the writer’s opinion.
- The H4 structure was firmly bullish at press time.
- A minor dip followed by further gains was a likely scenario.
Bitcoin [BTC] continued to post gains over the weekend but displayed signs of a bearish divergence with momentum indicators. It also traded beneath the $28.7k resistance, a level that had been BTC’s last stand before a plunge to $19k in June 2022. Solana [SOL] also reversed its drop to $16, and bulls pushed it back above $20.5.
How many are 1,10,100 SOL worth today?
The smart contract count and development activity were on the rise in March, which boded well for longer-term investors. Can the asset rise to the $26.6 range high once more?
A dip into the imbalance could offer bulls a chance to re-enter
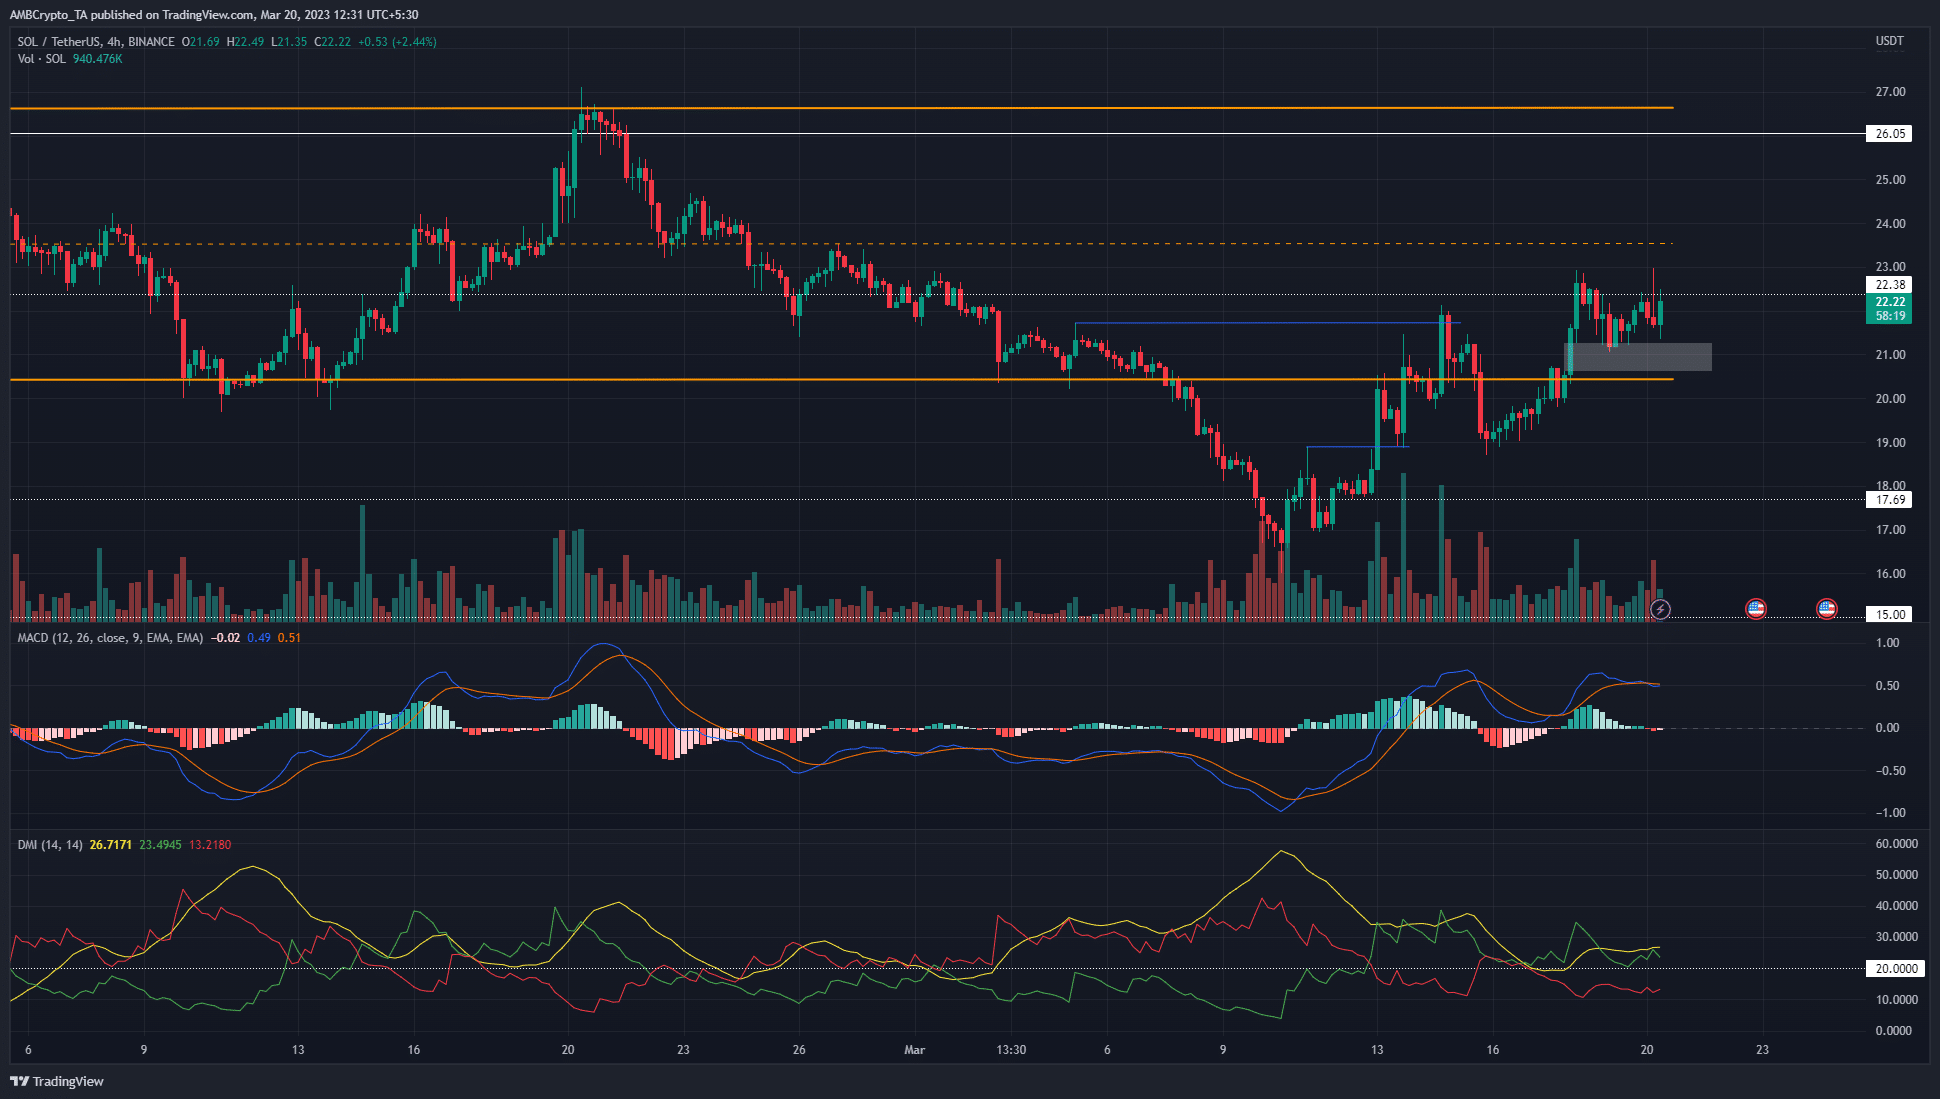
On the four-hour chart, two lower highs were marked in blue. Both of these lower highs have been beaten within the past ten days. The lower LH would be a more aggressive reading of the structure, and the upper LH would be a more conservative method.
Combined with the series of higher lows Solana has posted, the market structure was firmly bullish. Moreover, the price has also climbed back within the $20.5-$26.6 range. The price had traded within this range from mid-January to early March.
In the past two days, a move upward past $21 left an imbalance on the charts. This fair value gap was highlighted in white and lies close to the range lows. Therefore, a price move to the $20.5-$21 region could offer a buying opportunity targeting the mid-range resistance level at $23.5.
Is your portfolio green? Check the Solana Profit Calculator
Traders can opt to zoom in on lower timeframes to search for entries. On H4, the MACD showed bullish momentum. The DMI also showed a strong uptrend in progress with both the ADX and the +DI above the 20 mark.
The spot CVD began to make a reversal
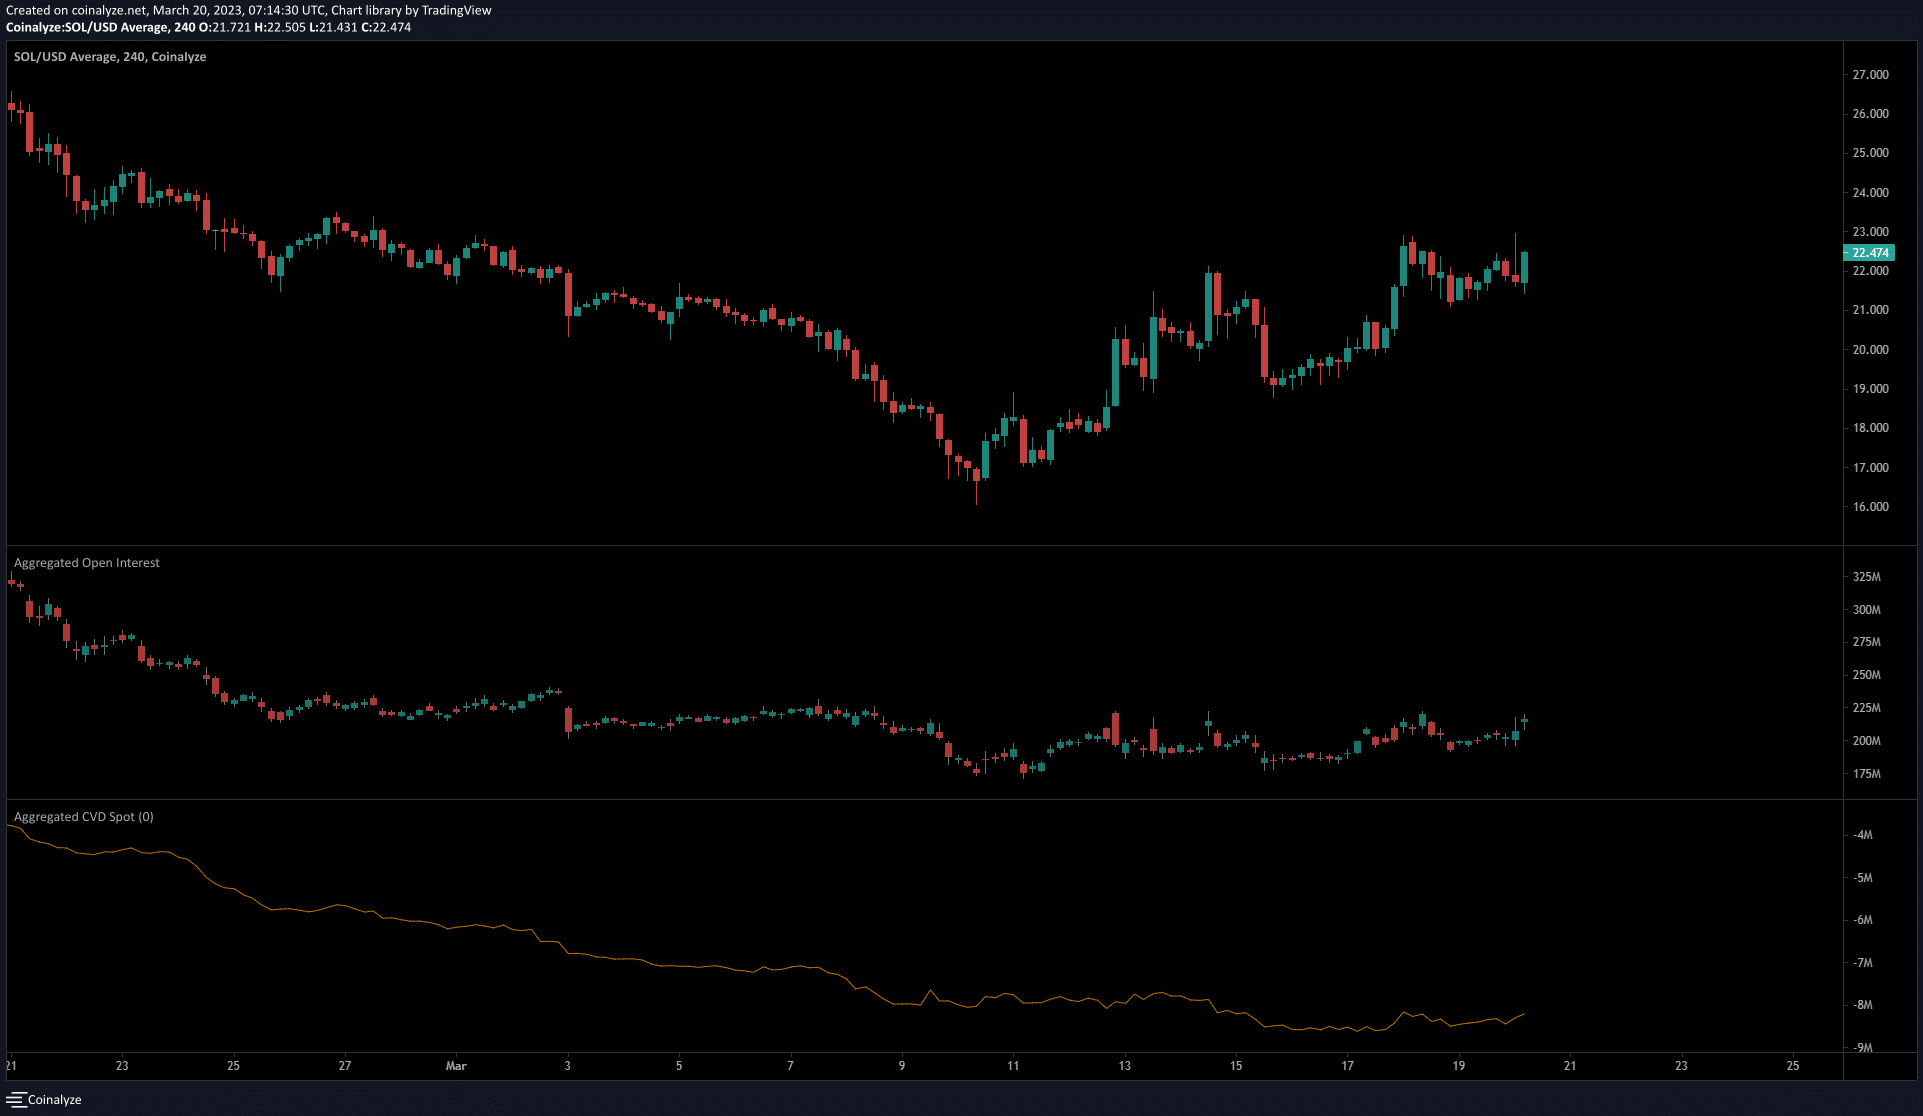
The four-hour chart on Coinalyze showed the Open Interest has gained close to $30 million since 16 March. During this time, the price has rallied from $19 to $22.2. The inference was that sentiment was bullish in the market.
The spot CVD has been in decline in recent months. However, this changed over the past two weeks. It formed a bottom and has registered some gains over the past few days, to reflect the buying pressure that drove SOL’s rally from $16.


