Solana [SOL] rebounds from the $60 mark, should investors go long now

Disclaimer: The findings of the following analysis are the sole opinions of the writer and should not be considered investment advice
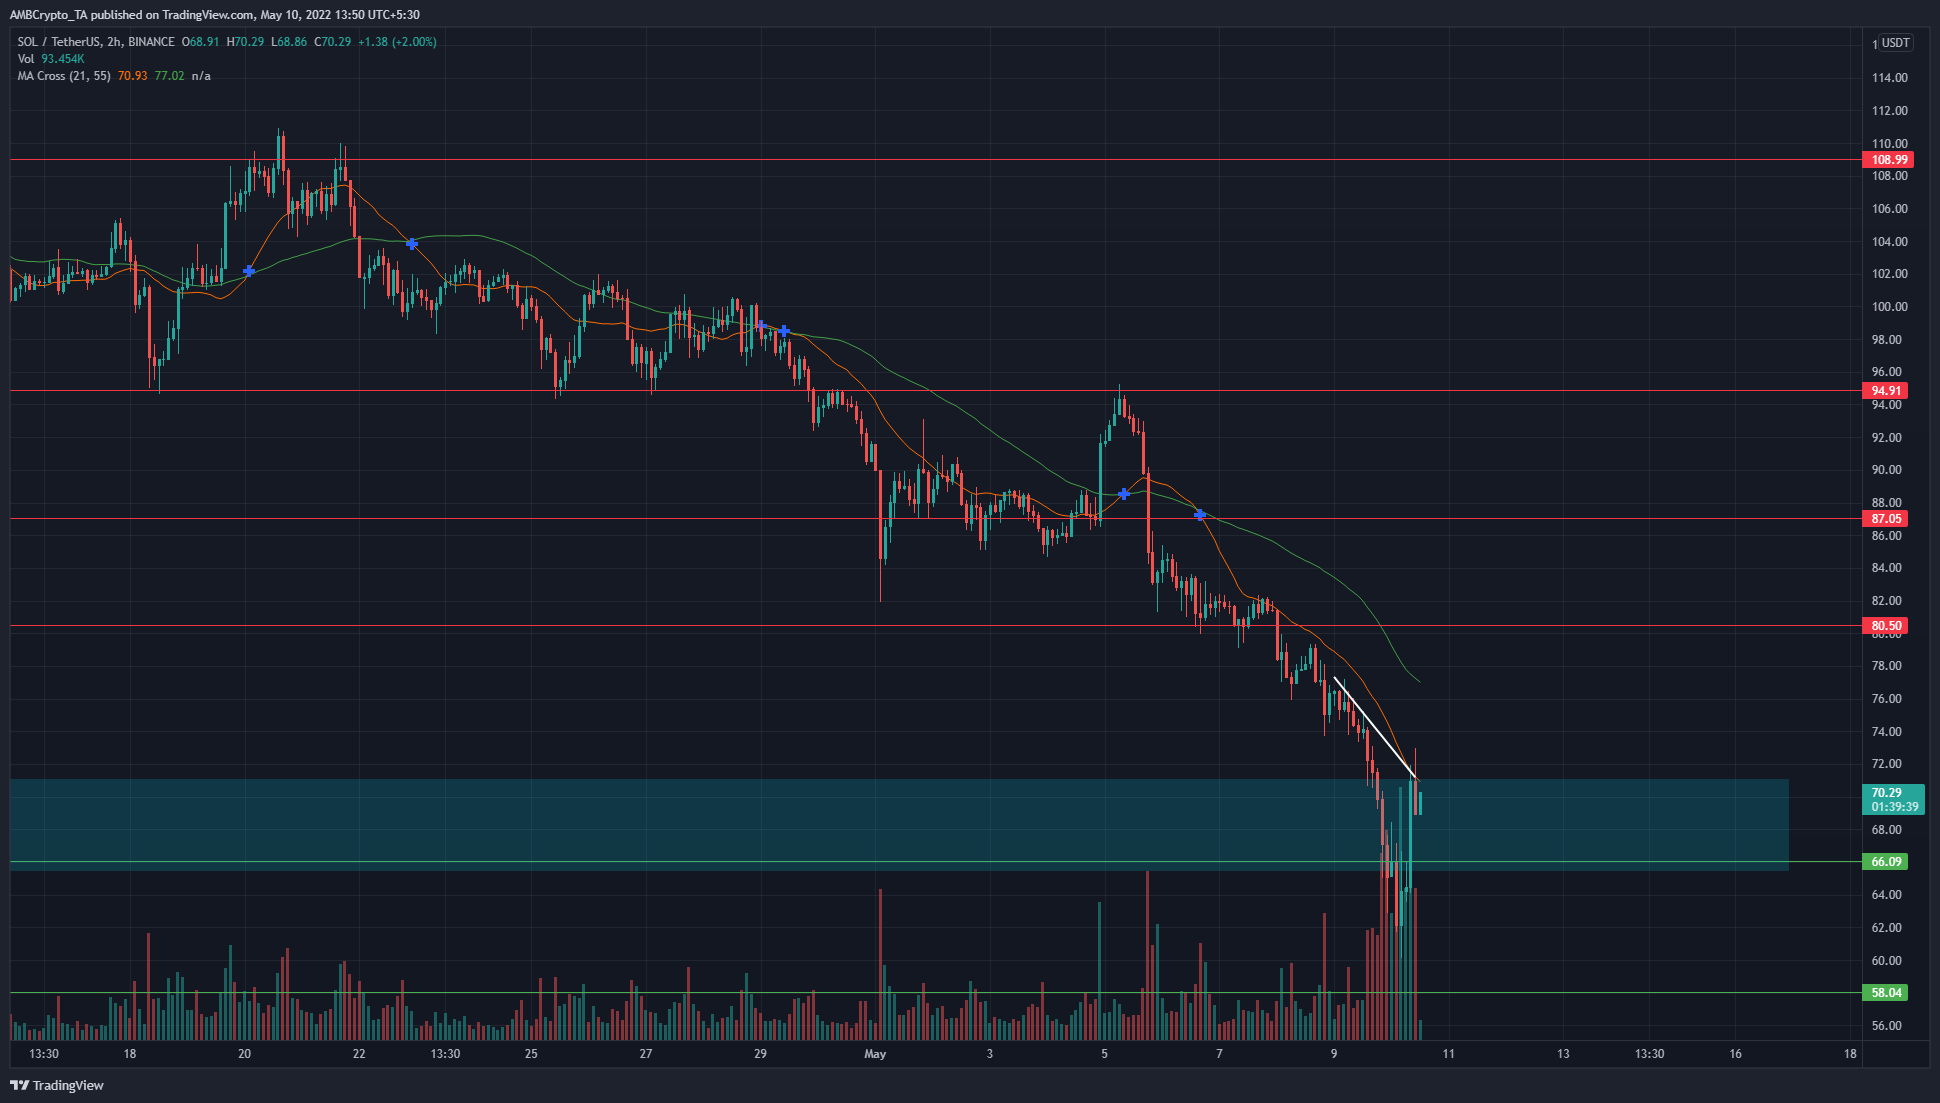
Bitcoin reached lows that it had last traded at in July 2021, and Solana reached an area of demand from last August. Does that mean a relief rally is around the corner? In a way, that relief was already visible on the charts. Solana dropped as low as $60.13 before bouncing to $70.17, a move that measures around 21% from the swing low. It appeared that the bears could be back in the driving seat once more.
SOL- 2 Hour Chart
The cyan box extends from $66 to $71 and has been an area of demand in the past. In August 2021, the price flipped this region from resistance to support and rallied to reach $216 and $260 in September and November respectively.
Since late November, the price has been on a downtrend on the higher timeframes. The trend has been bearish on the shorter timeframes as well after the $94.9 level of support gave way in late April.
Will SOL reverse its trend at this high time frame demand zone? It is unlikely, despite the strong bounce. On the lower timeframes, the $74-$76 area could offer resistance, as well as the $80.5 level.
Rationale
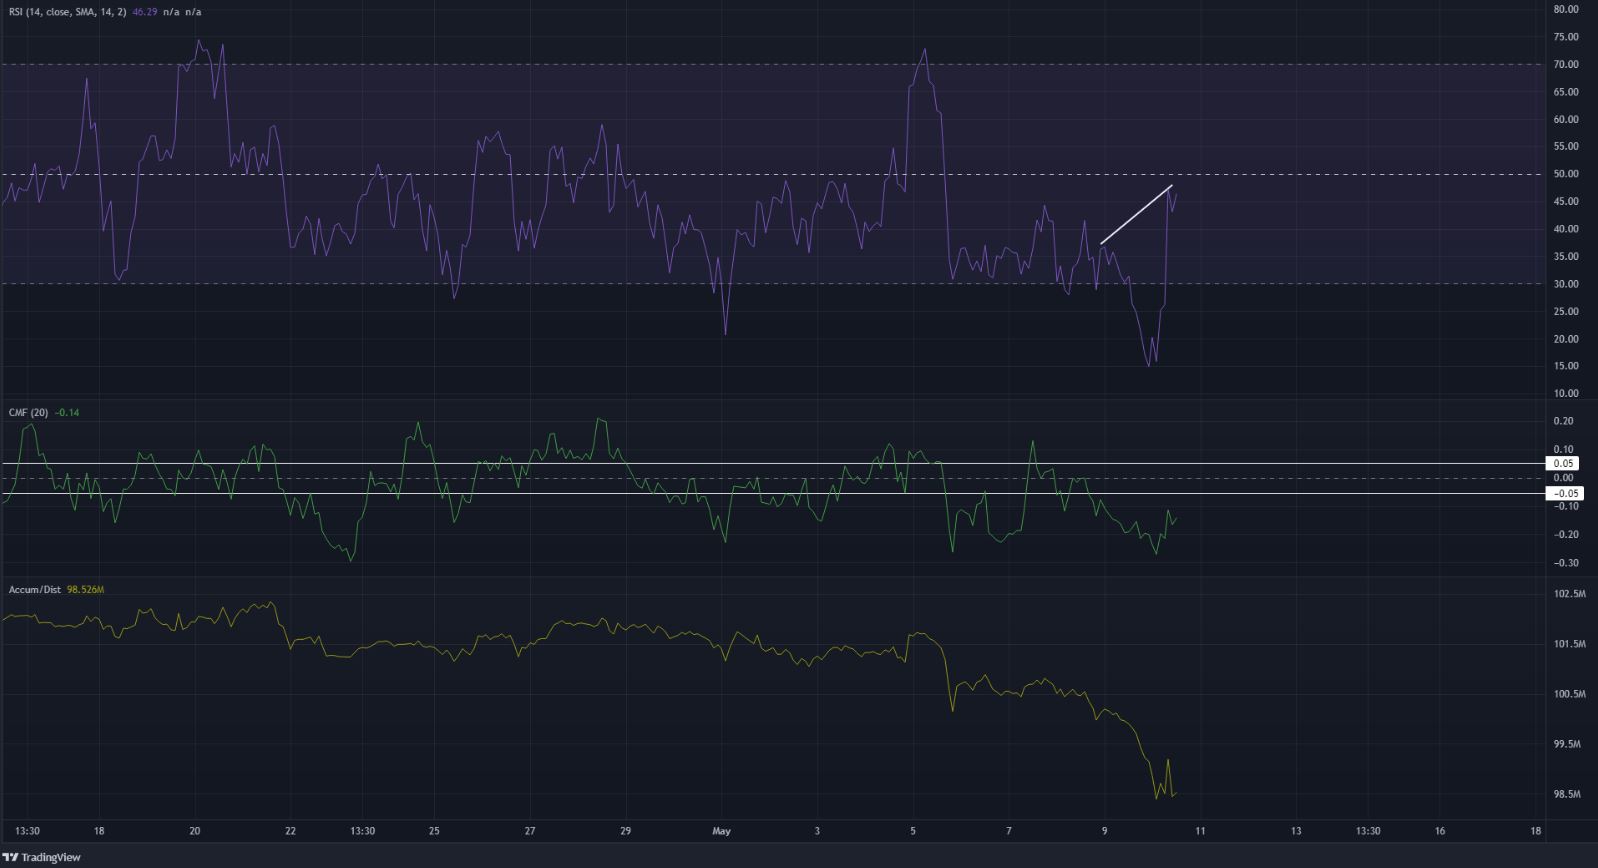
On the two-hour chart, the RSI has been below the neutral 50 line for the better part of the past week. At the same time, the price has made a series of lower highs and lower lows. Moreover, the 21-period moving average (orange) has been below the 55 SMA as well. All of these were indicative of a persistent downtrend in the past two weeks.
The RSI also registered a hidden bearish divergence, where the RSI made higher highs but the price formed lower highs. This development on the hourly chart also suggested that the downtrend could resume the following day.
The Chaikin Money Flow was beneath the -0.05 mark as well, to denote significant capital flow out of the market. This was to be expected, after the strong downtrend of the past few days and the heavy selling pressure the previous day. Correspondingly, the A/D line was also plumbing new depths.
Conclusion
The indicators unanimously showed strong bearish momentum and heavy selling pressure, and the price action was also of a bearish nature. The bounce from the $65 area could push as high as $75. To the north, the $75 and $80 areas are likely to pose resistance to the bulls’ attempts at recovery.


