Solana [SOL] slumps to $21 but can the bulls mount a comeback

Disclaimer: The information presented does not constitute financial, investment, trading, or other types of advice and is solely the writer’s opinion.
- The higher timeframe market structure was bullish.
- The volatility of the previous day meant some gains were likely today to fill some imbalances.
Solana saw high volatility on the price charts around 14 March but has been more subdued over the past few days. It has formed a lower timeframe range. Bitcoin’s inability to drive past the $28k mark meant sentiment could be beginning to shift bearish once again in the near term.
Realistic or not, here’s SOL’s market cap in BTC’s terms
The structure of both BTC and SOL remained strongly bullish, and lower timeframe traders can small move upward over the next 24 hours. A BTC move above $28.8k or below $26.6k could decide the direction of the next move.
Shorter timeframe traders can keep an eye on this range
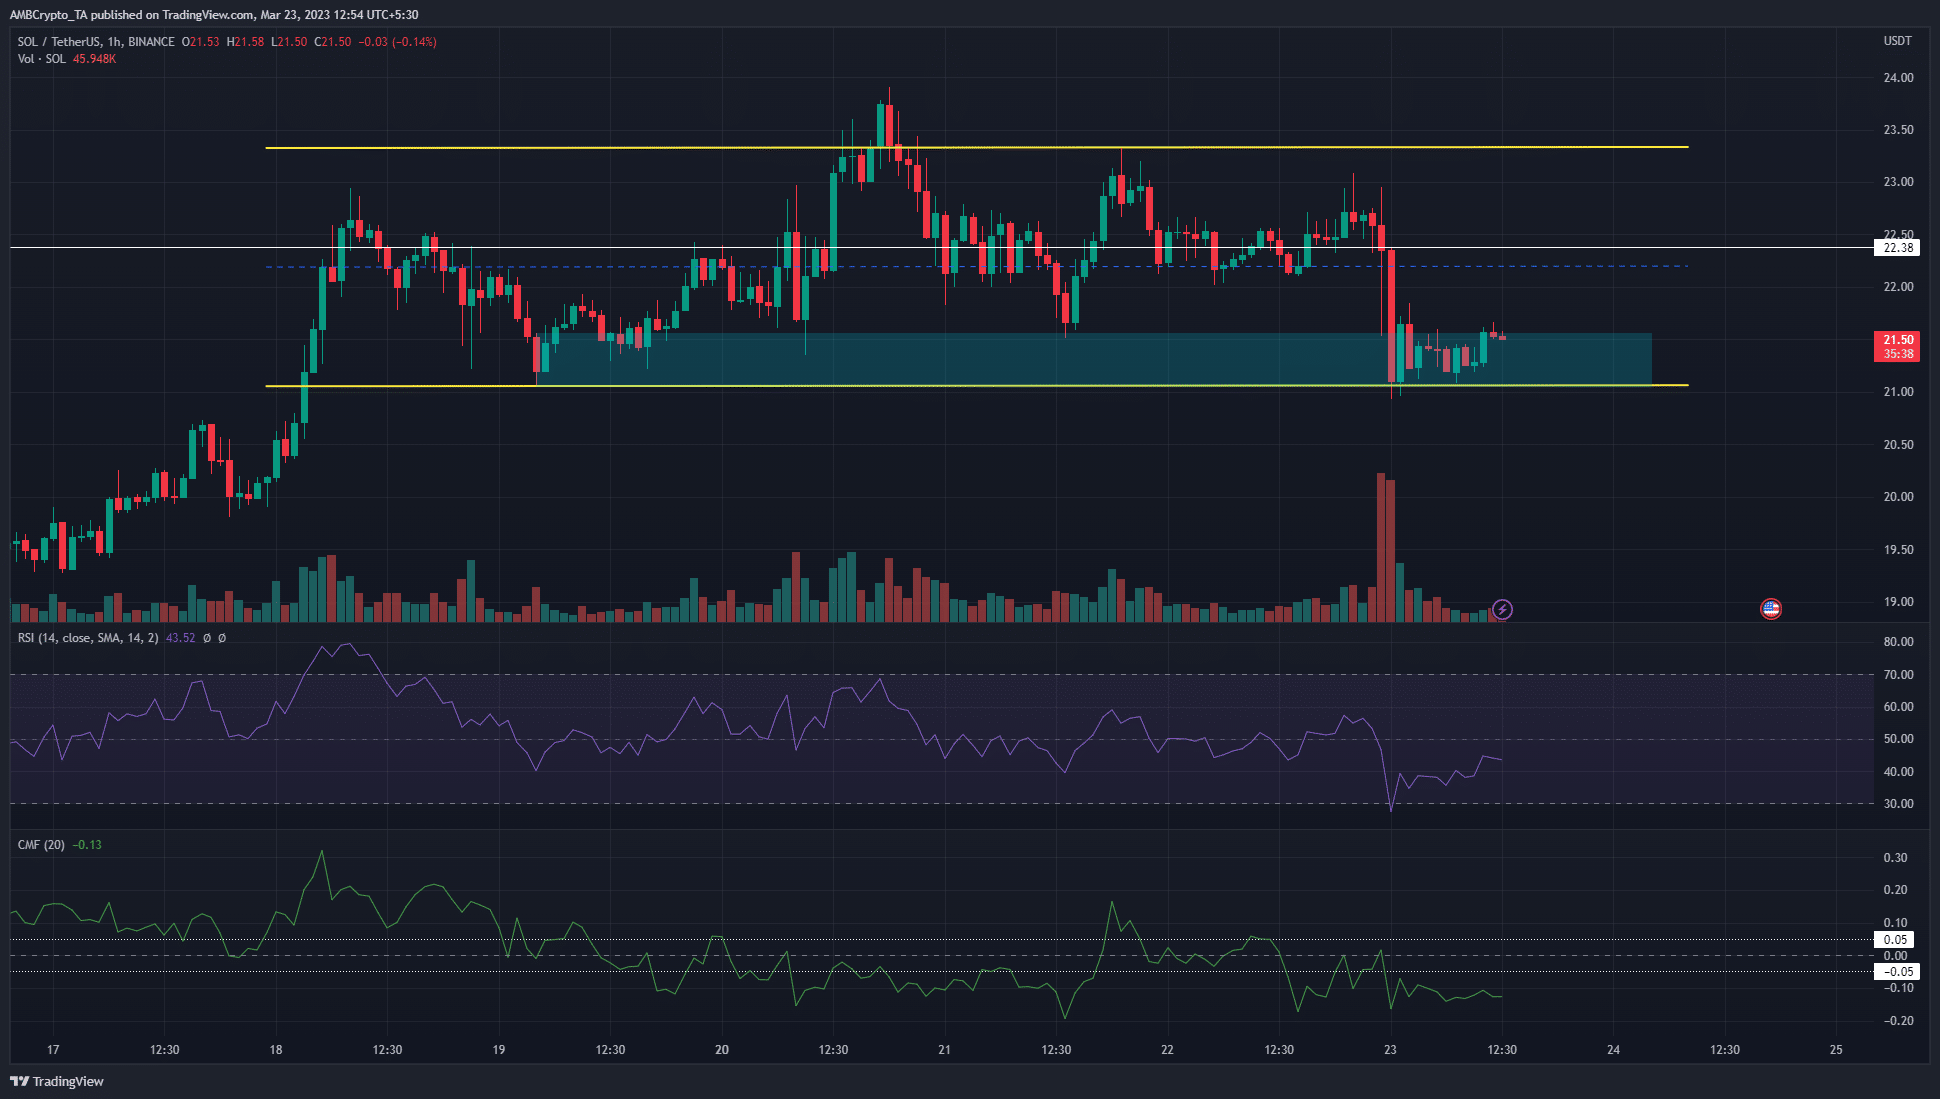
The 1-hour chart showed that Solana has traded within a range between $21.05 and $23.3 over the past five days. A look at higher timeframe charts such as 4-hour showed that the bias was bullish after the recovery from $16.
To the south, the $21 and the $20-$20.5 regions are expected to act as support. A move below $21 would flip the lower timeframe bias to bearish. A weak reaction from the $20.5 region would be an early indication of weakness from the buyers.
At the time of writing, the bulls still had some hope. They had defended the $21 mark. The RSI continued to move beneath neutral 50 and showed bearish momentum behind SOL. Meanwhile, the CMF on H1 stood at -0.12 to show heavy capital flow out of the market.
How much are 1, 10, or 100 SOL worth today?
The bullish case for Solana would be a pump toward the mid-range or range highs at $22.2 and $23.3 respectively. Buyers from the $21 area can take profits at these levels.
A drop below $21 would shift the sentiment in favor of the bears, and a drop below $20 would be a strong sign of seller dominance.
The futures market showed sentiment leaned in bearish favor
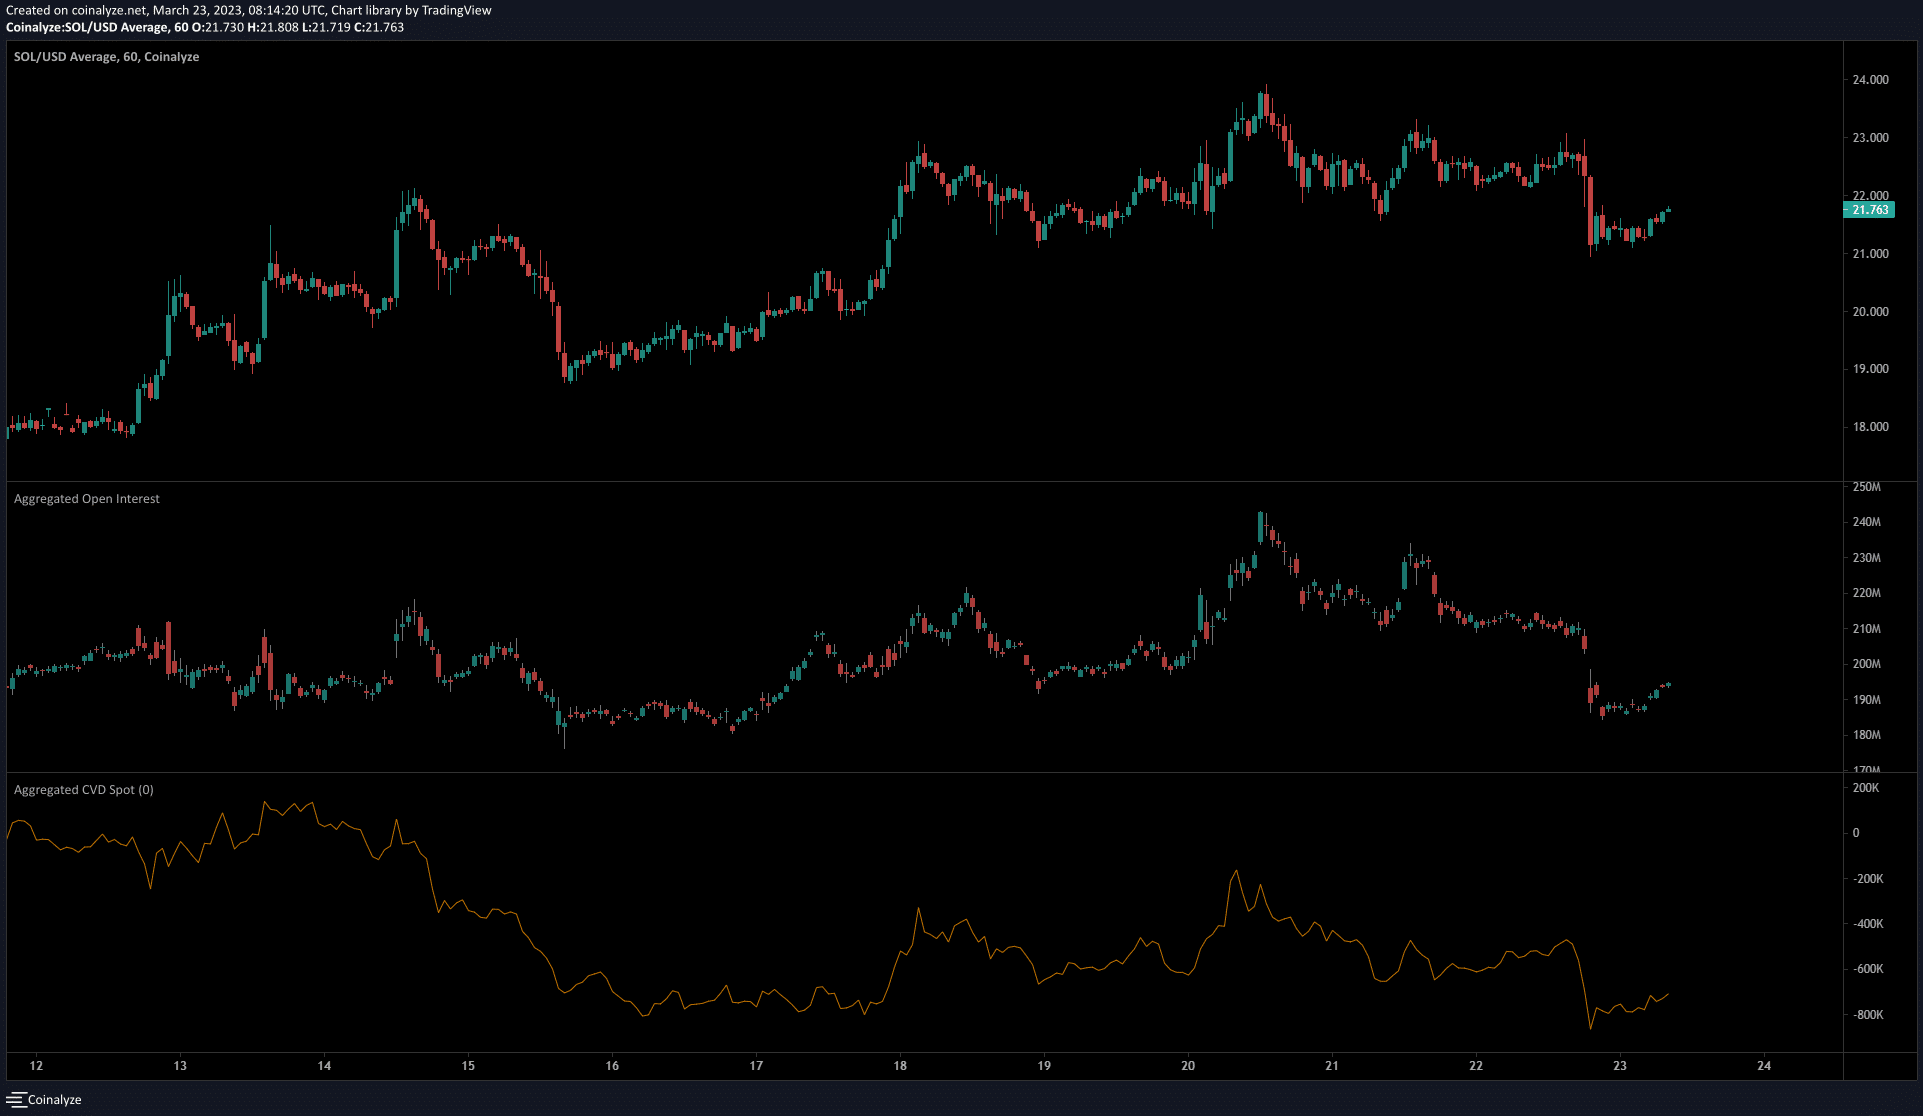
The Open Interest took a strong hit when Solana slumped from $22.7 to $21.
The decline in OI measured close to $23 million according to Coinalyze data. The inference was that the majority of the market was not yet actively shorting the asset.
Yet, the increase in OI following the retest of a support level was not remarkable, which was another sign of some indecision and fear from buyers.
The spot CVD also highlighted strong selling pressure in the past few days, and the cumulative volume has been in a steady decline.
Hence, the lower timeframe traders who are bullish on SOL around the $21 region must be prepared for the development of a bearish scenario as well.


