Solana [SOL]: Unraveling breakout potential of this reversal pattern

Solana’s [SOL] immediate ceiling in the $43-$46 range has constricted the buying efforts over the last two weeks. The reversals from this range have reignited the near-term selling edge. Thus, the alt fell below the 20/50/200 EMA while chalking out a descending channel in the 4-hour timeframe.
Meanwhile, the week-long trendline support has cushioned the altcoin’s troughs. Any break above the current pattern can open doorways for near-term gains before a likely reversal. At press time, SOL was trading at $39.05.
SOL 4-hour Chart
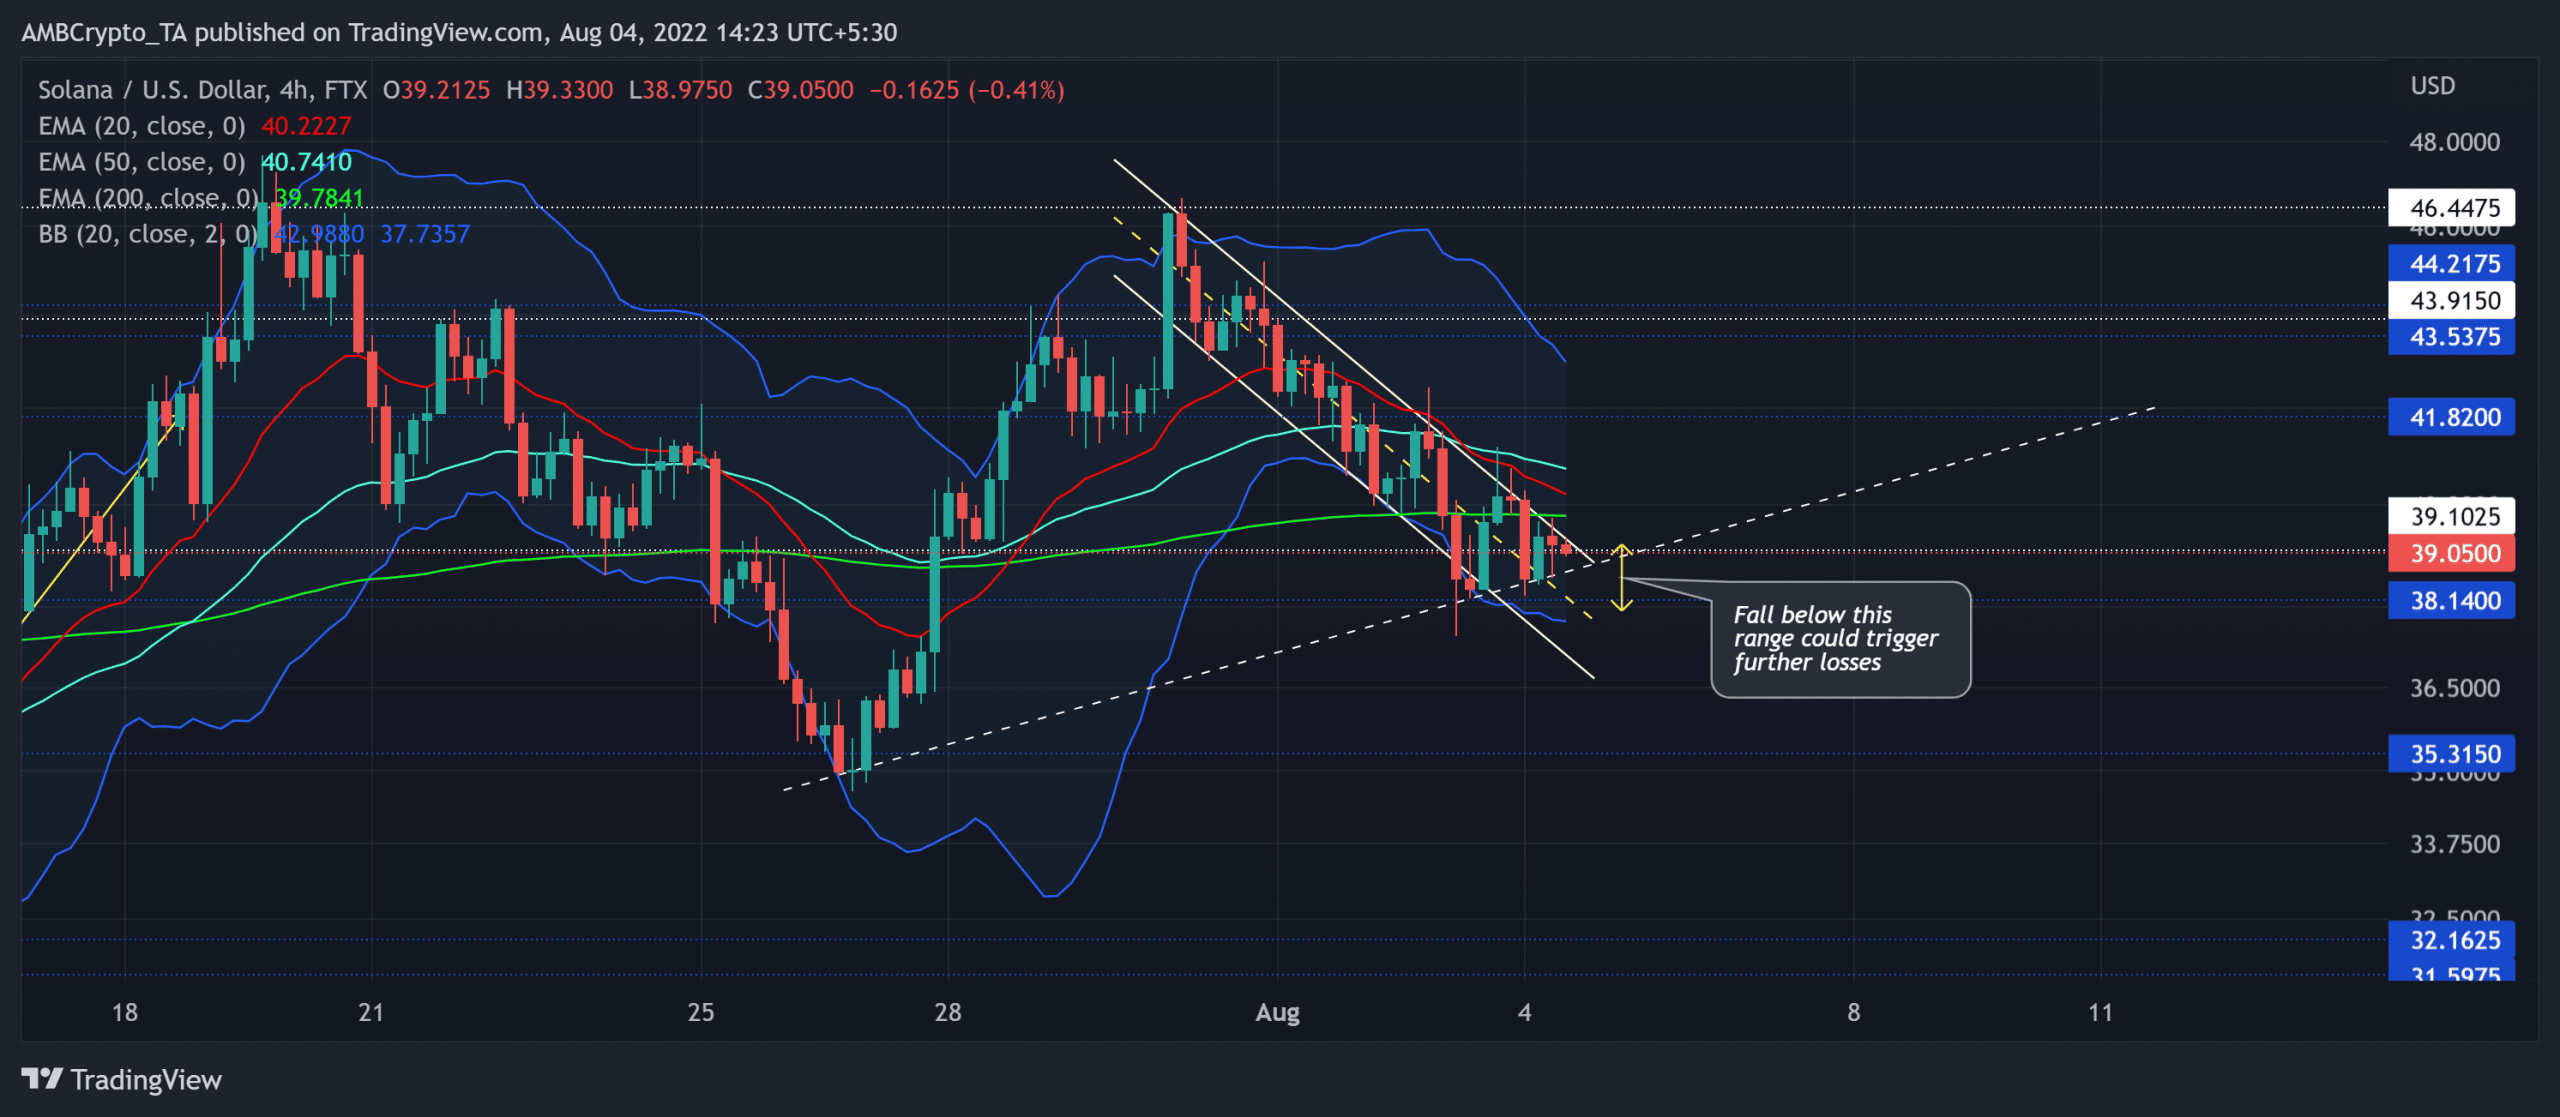
SOL’s reversal from the $46-mark has pulled the alt toward the lower band of the Bolliger Bands (BB). To top it up, the south-looking bearish crossover of the 20/50 EMA has further impaired the buying rallies.
Over the last week, the trendline support has inflicted a rejection of lower prices. This diagonal support alongside the $38-$39 range can propel near-term comeback inclinations.
A potential break above the pattern could provoke a sluggish phase followed by a retest of the $41-$43 zone in the coming sessions. A continued recovery in the coming days could further affirm the existence of an ascending triangle.
However, a bearish crossover with the 200 EMA (green) can delay the near-term recovery. Also, the recent bearish engulfing candlestick has reflected a bearish edge. A close below the $38-zone could propel a test of the $35 level before a likely revival.
Rationale
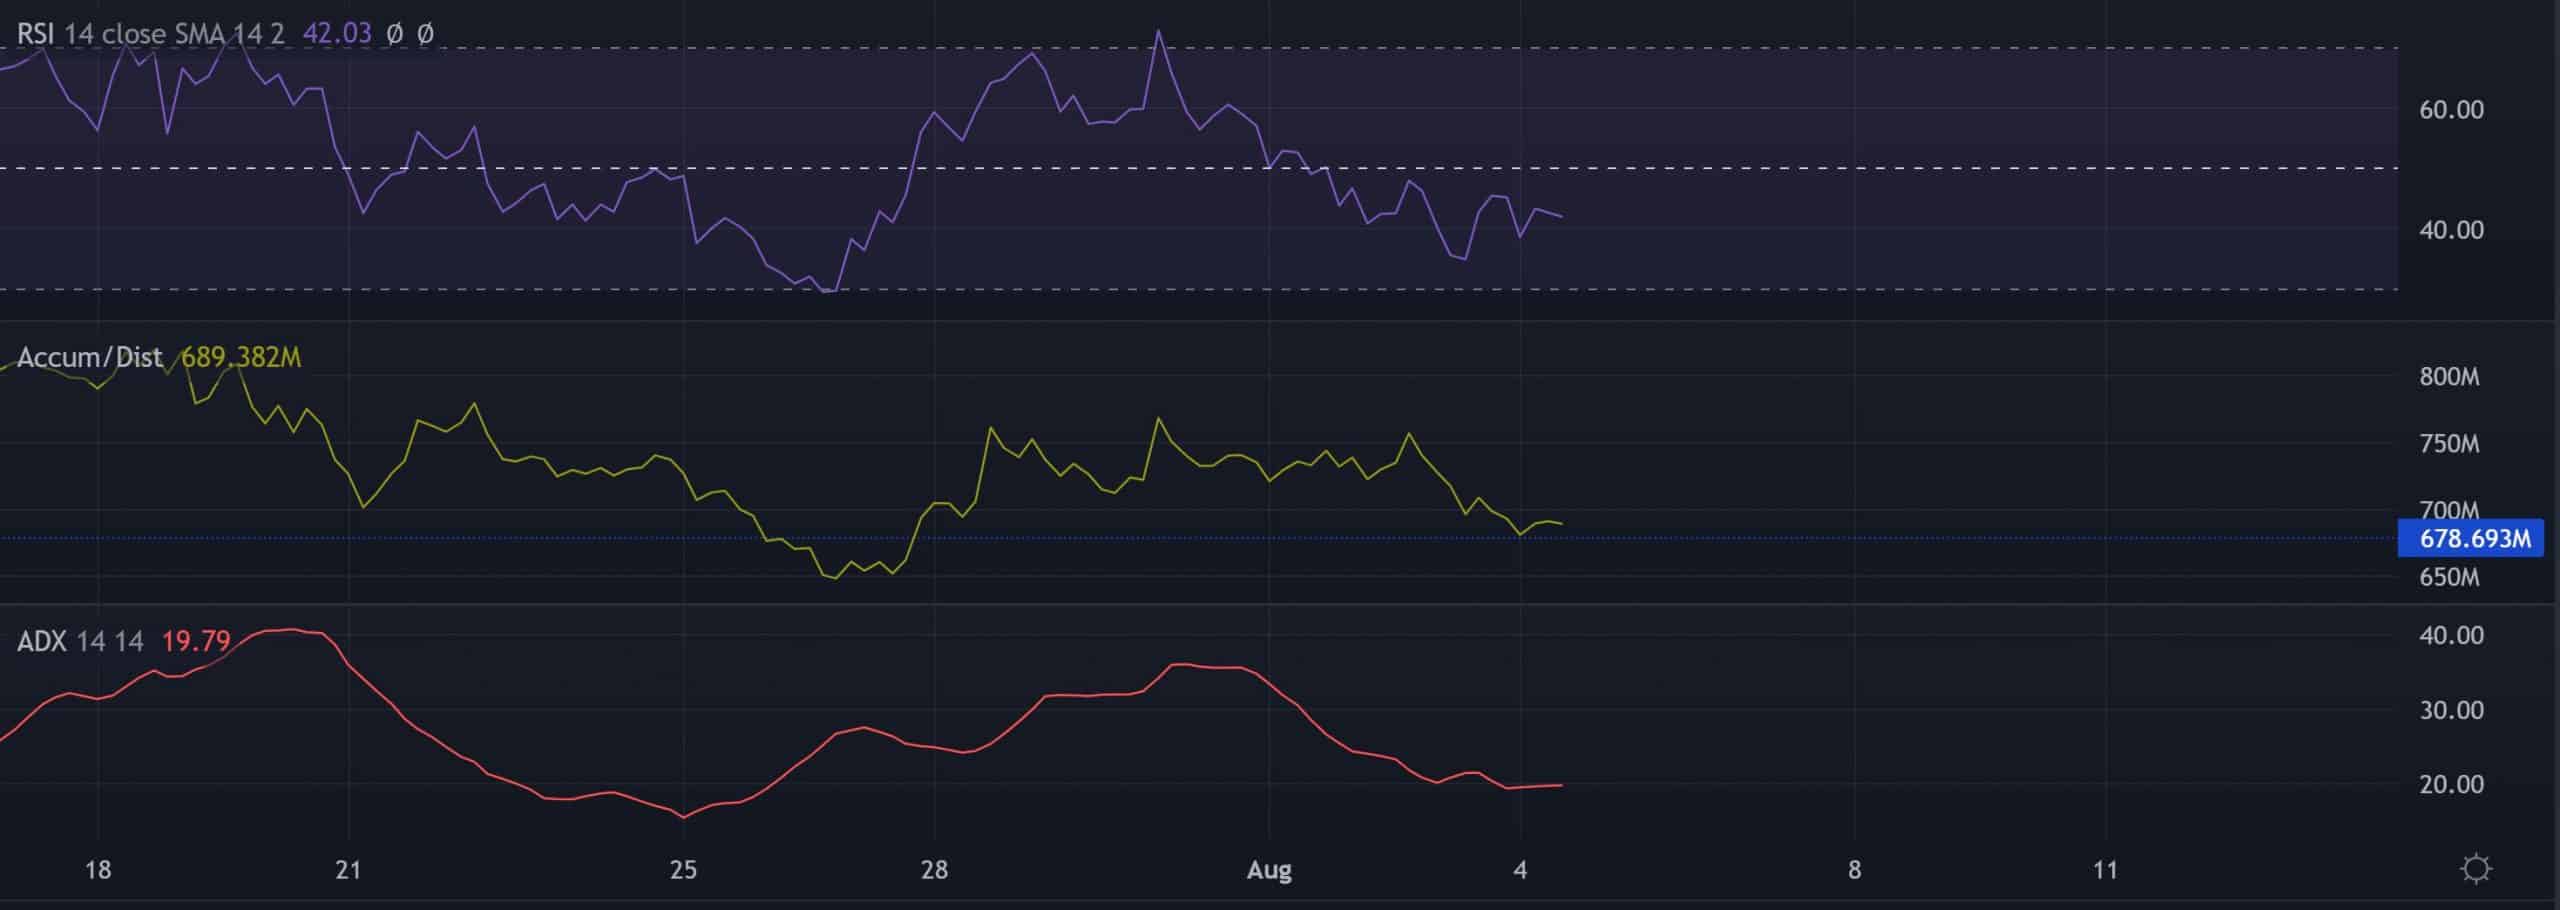
The Relative Strength Index (RSI) failed to find a spot beyond its equilibrium. Given its bearish tendencies, buyers still needed to ramp up the buying volumes to provoke a bounce-back.
Nonetheless, the Accumulation/Distribution line registered lower troughs over the last three days. So a rebound from its immediate trendline support could affirm a bullish divergence with price. But the ADX for the alt displayed a considerably weak directional trend.
Conclusion
Given the bearish signs near its south-looking EMAs, SOL stood in a tricky spot. The $38-$39 range could play a vital role in the alt’s near-term movements. The triggers and take-profit levels would remain the same as above.
Importantly, investors/traders must keep a close eye on Bitcoin’s [BTC] movement to determine its effects on the broader sentiment.