- SOL showed the highest seven-day increase.
- Its price has lost momentum in the last 24 hours.
Recent analysis indicates that Solana [SOL] experienced the largest decline among the top five cryptocurrencies in the last 24 hours.
Despite this setback, data also revealed that it has recorded the highest uptrend among the top five assets over the past seven days.
Are there any metrics suggesting that Solana may sustain this upward momentum and surpass its current price resistance?
Solana sees mixed price trends
According to data from CoinMarketCap, Solana has experienced the most significant decline among the top five crypto assets in the last 24 hours, as of press time.
Within this period, SOL has dropped by over 6%. Despite this decline, its market capitalization was around $65.5 billion, positioning it as the fifth-largest crypto asset by market cap.
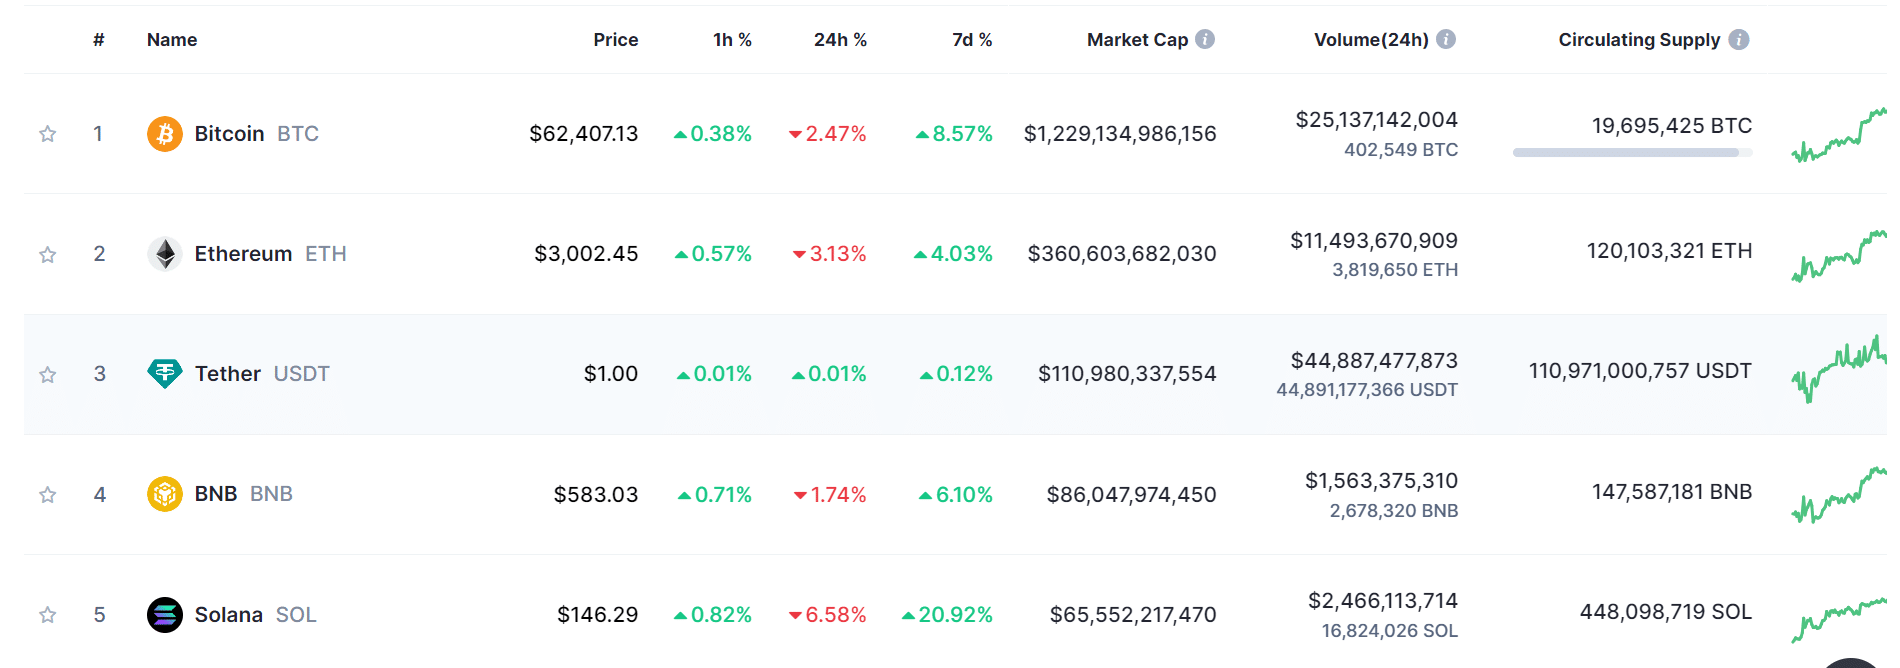
Source: CoinMarketCap
However, SOL remained poised to become the top-performing asset in terms of price increase over the past seven days.
The chart revealed a remarkable uptrend of over 20% during this period, surpassing other top assets.
Suppose Solana can sustain this positive price trajectory. In that case, it may emerge as the highest gainer among the top five and potentially overcome its immediate resistance levels.
Solana trends below the moving average
After a streak of consecutive uptrends that propelled the Solana price from around $134 to over $150, a downturn occurred on the 7th of May.
Examination of the daily timeframe chart revealed a decline of over 3%. This resulted in the price dropping to around $148.
This decline interrupted the series of increases that had brought it close to breaking through its press time resistance level.
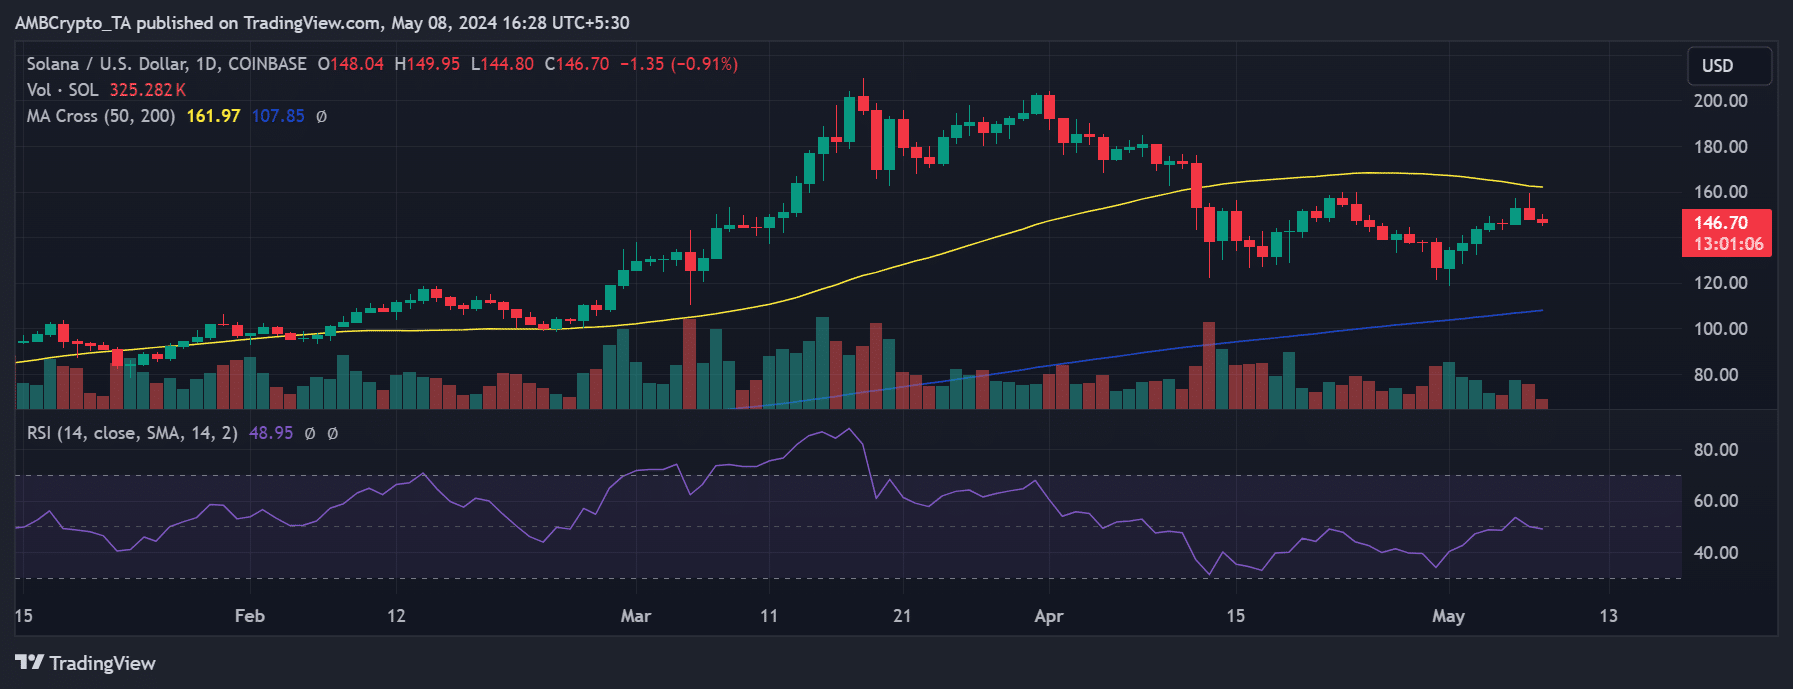
Source: TradingView
AMBCrypto’s analysis indicated that its short moving average (yellow line) acted as resistance around the $162 price region.
Should Solana surpass this level, it could potentially retest the $200 price zone, as it has done twice this year. As of press time, it was trading at around $146, reflecting a decline of less than 1%.
Additionally, it was experiencing a weak bear trend at press time, with the Relative Strength Index (RSI) slightly dipping below the neutral line.
SOL metrics not strong enough
AMBCrypto’s look at Solana’s Open Interest on Coinglass indicated a minor uptick recently, with the Open Interest reaching $1.86 billion at the time of this writing.
This suggested a slight increase in the funds entering Solana within the last 24 hours. However, for any significant impact on the SOL price, a more substantial volume would be required.
Read Solana’s [SOL] Price Prediction 2024-25
Furthermore, its volume on Santiment revealed a decline in activity of late. While the volume stood at over $3 billion at the close of trade on the 7th of May, it had decreased to around $2.4 billion at press time.
These metrics would need to show higher figures to see a potential uptrend in the SOL price.
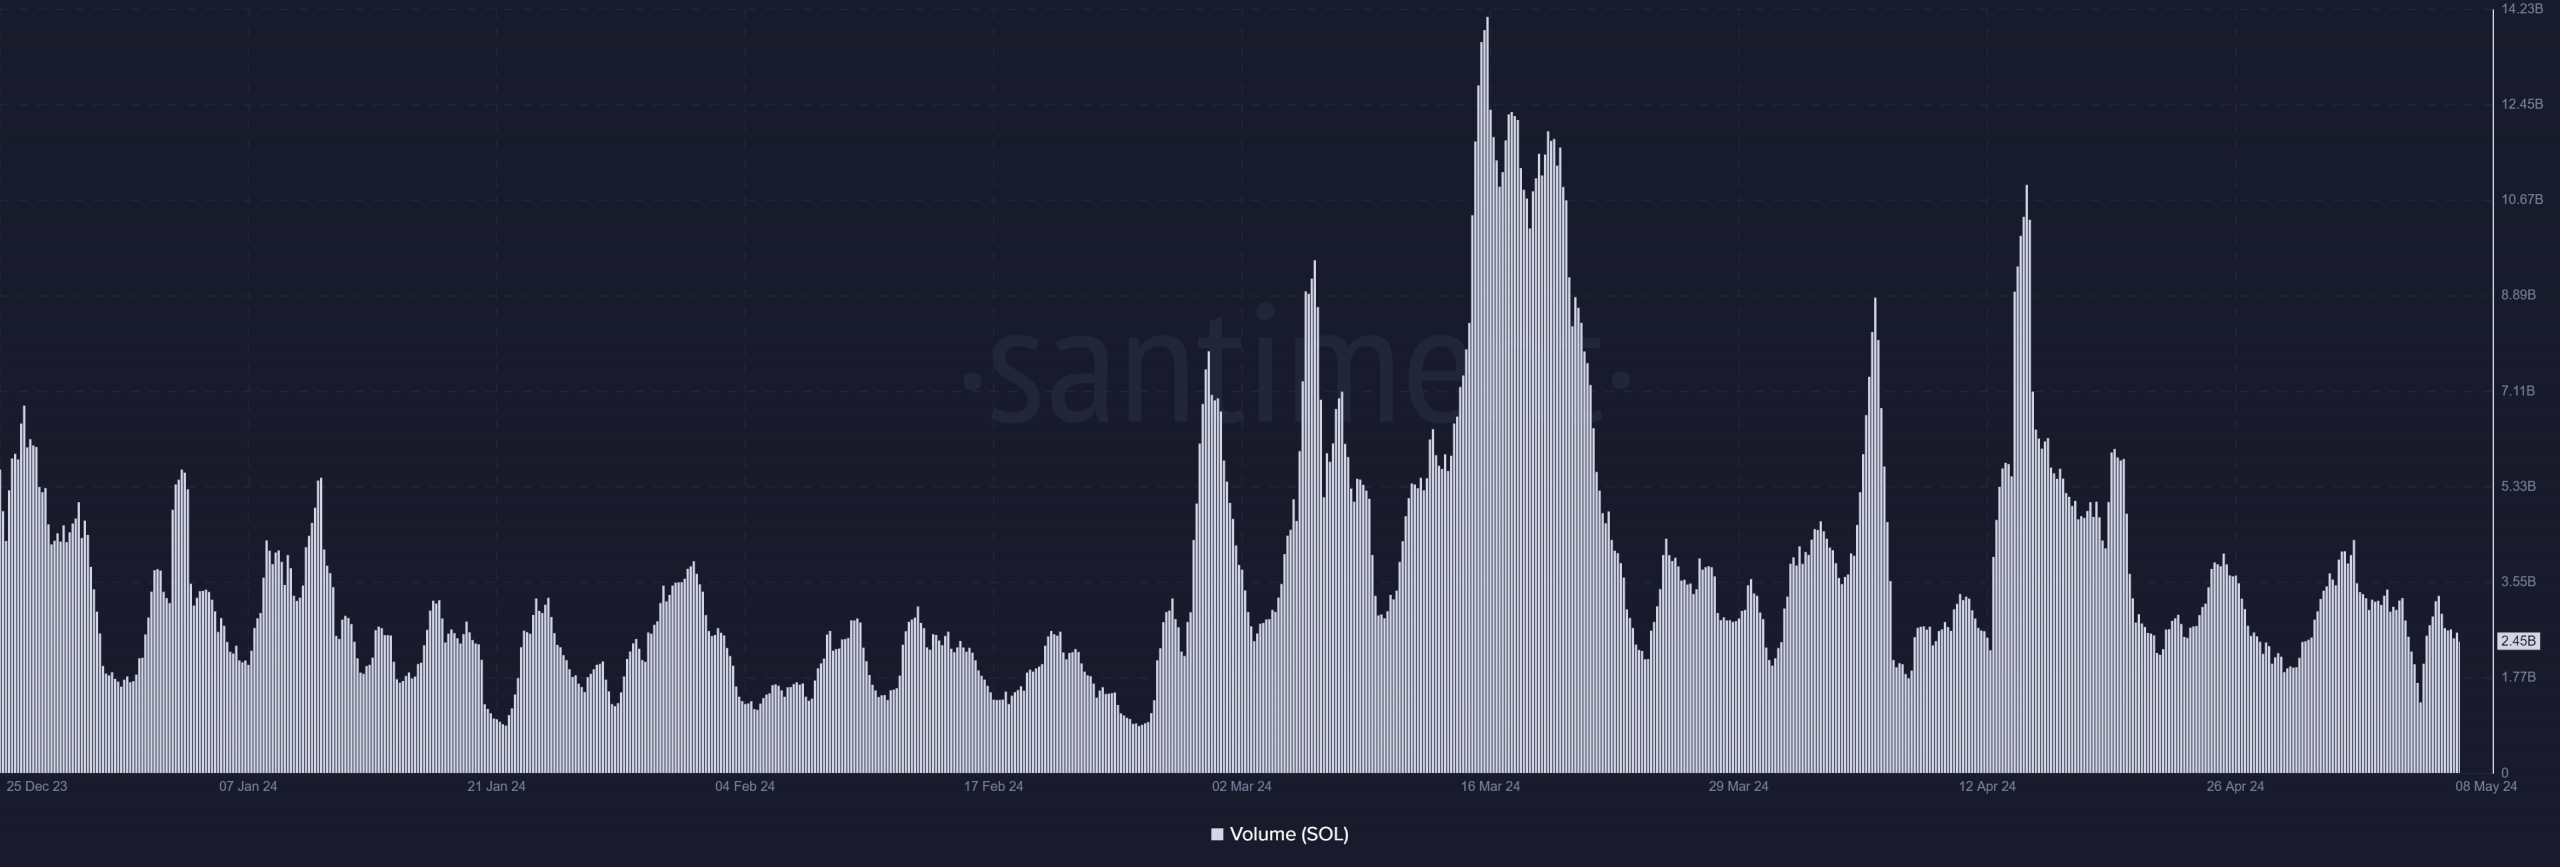
Source: Santiment