Solana, Tezos, MANA Price Analysis: 20 February

While the broader sentiment drifted back into the fear zone, Solana, Tezos and MANA revealed oversold readings on their 4-hour chart. Accordingly, they lost crucial support levels and flipped them to immediate resistance.
Solana (SOL)

SOL saw a nearly 44% loss (from 20 January) and touched its five-month low on 24 January. Since then, it saw an over 50% jump toward its $120-resistance. During this phase, it formed an up-channel on its 4-hour chart.
Since then, the alt downturned to test its 50 EMA (red) and eventually flipped the $92-mark from support to immediate resistance. The bulls have managed to keep the $83-level intact for over five months now. Thus, further retracements should find testing grounds near that level.
At press time, SOL traded at $86.39. After losing its midline support, the bearish RSI tested the 43-point resistance multiple times but struggled to show revival signs. A further retest of the oversold region before picking itself up seemed likely. Also, the -DI (of the DMI) looked north, justifying the near-term bearish tendencies of SOL.
Tezos (XTZ)
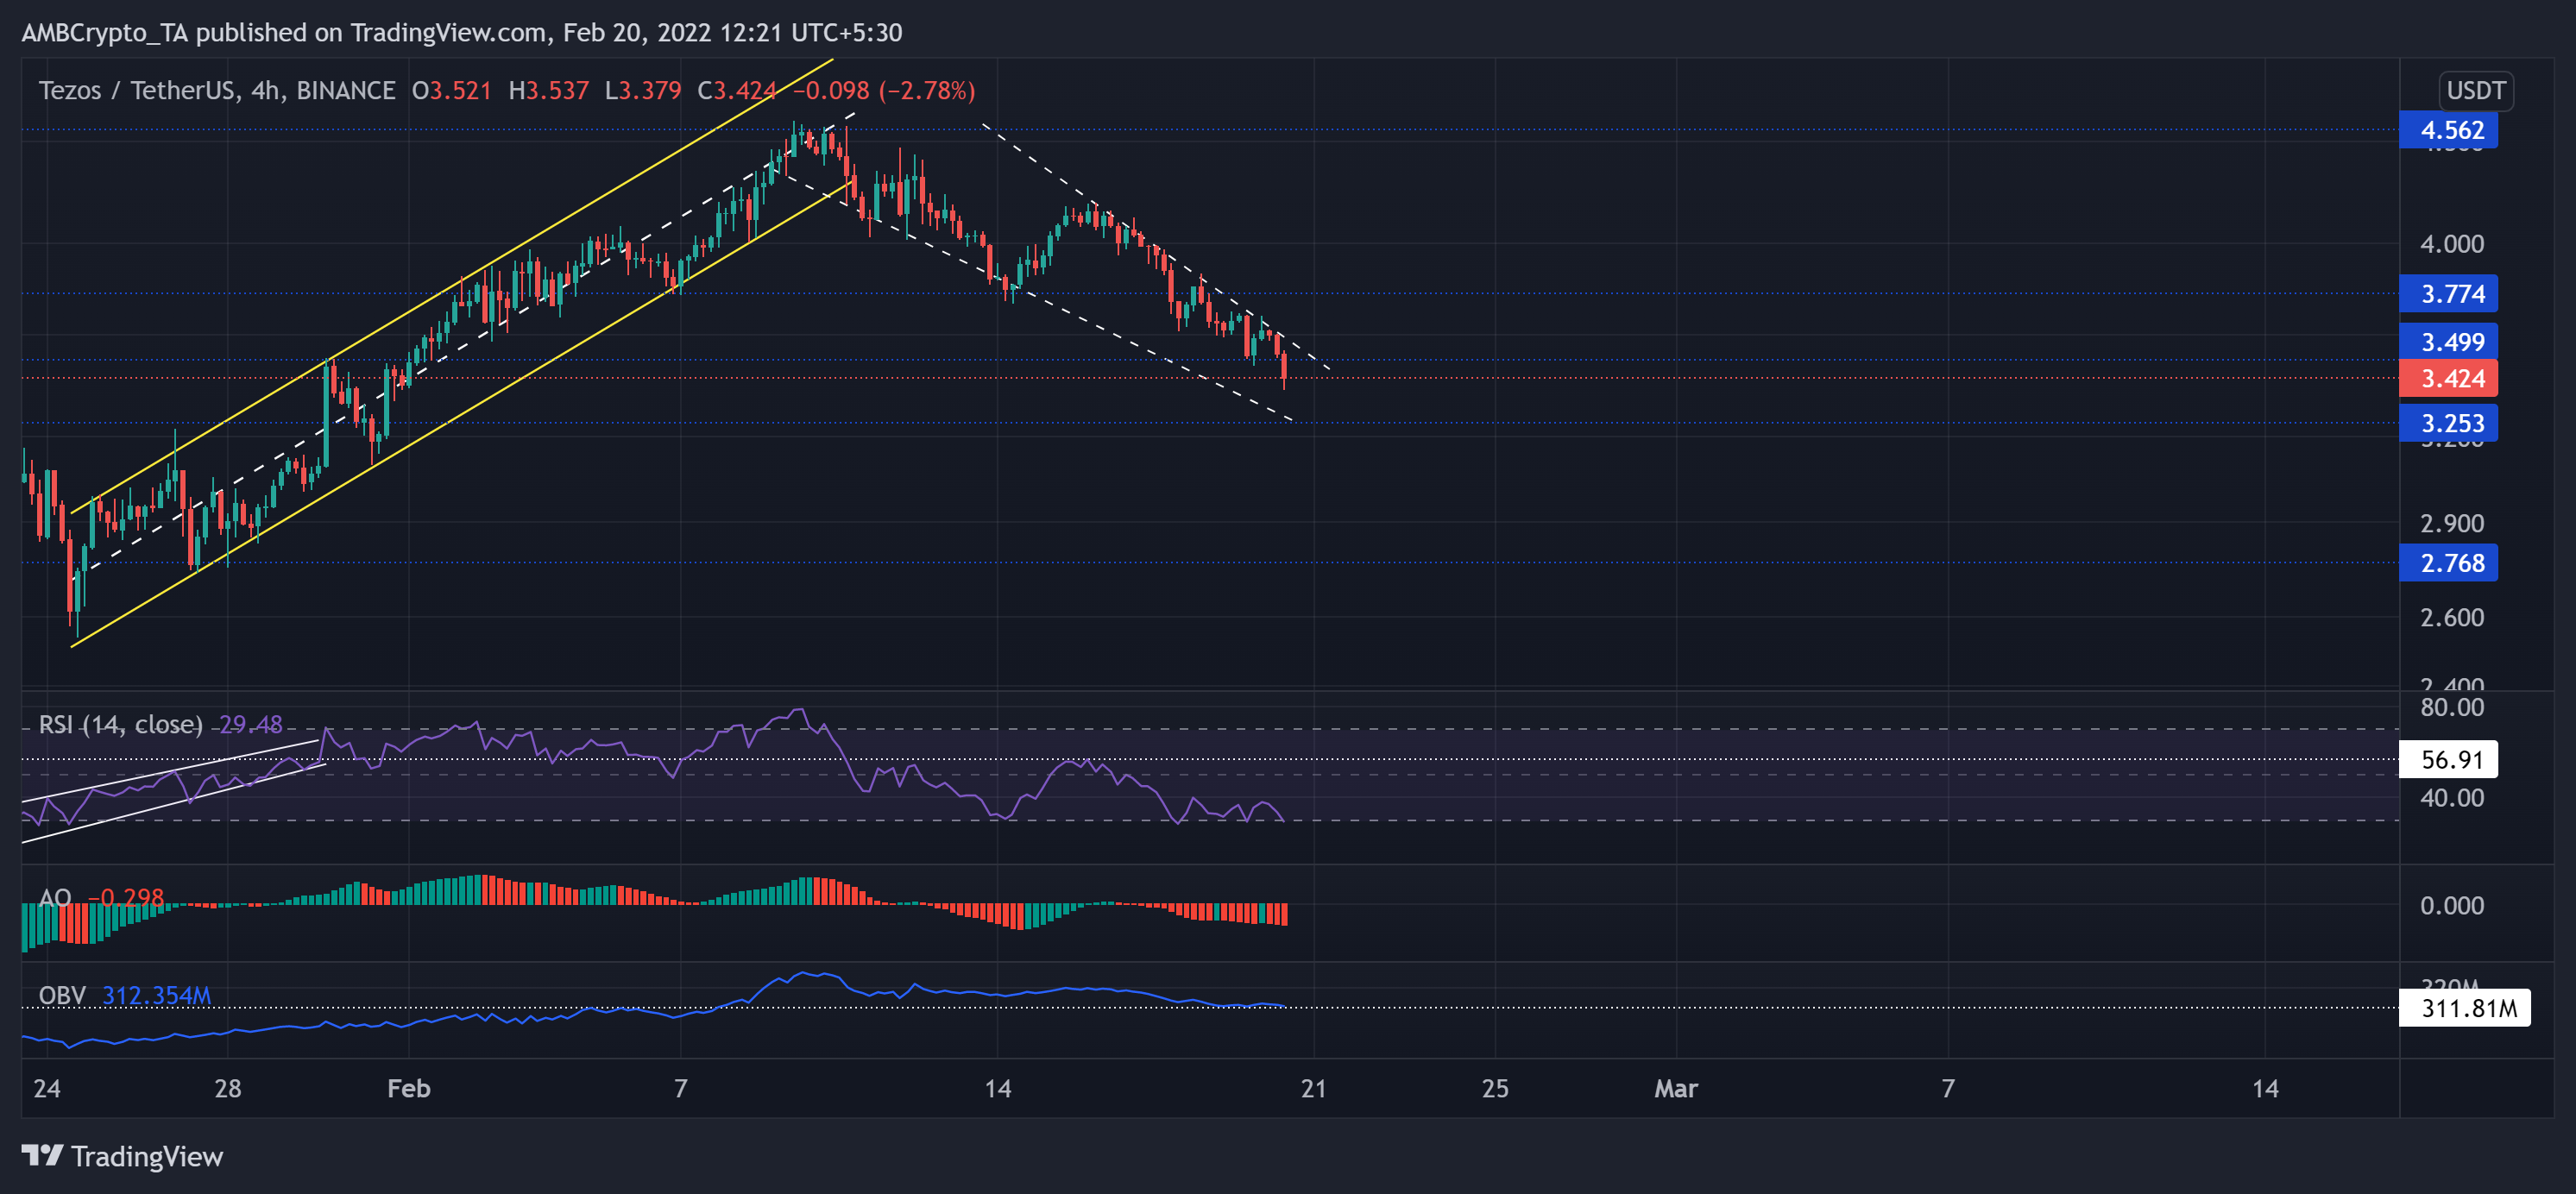
As XTZ plunged towards the $2.7-zone, the bulls took over as the alt bounced back and jabbed through crucial price points.
The altcoin witnessed an 81.2% ROI (from its six-month low on 24 January) while forming an ascending channel (yellow). As a result, it tested the $4.5-mark on 10 February. Since then, the broader sell-off fueled the up-channel breakdown as XTZ lost the $3.4-mark (immediate resistance). Any further fall decline would find a floor at the $3.2-level.
At press time, XTZ was trading at $3.424. Over the last four days, The RSI saw a 27-point fall from its midline and tested the oversold region multiple times. It still showed no revival signs. On top of it, the AO affirmed the bearish vigor by marking lower peaks. But the OBV maintained the support that upheld higher prices in the past, hinting that the buyers had not lost complete control.
Decentraland (MANA)

Since touching its 11-week low on 22 January, the alt saw a staggering 107.4% ROI until 9 February. Then, MANA witnessed an up-channel (yellow) breakdown and tested the $2.7-mark.
Since then, the alt recovered after forming a near-term demand-zone (rectangle). However, it witnessed a 21.2% loss in just the last four days, while the 20 SMA (red) and the 50 SMA (grey) are on the verge of a bearish crossover. Now, a sustained close below the demand zone could propel a further fallout.
At press time, MANA traded below its 20-50-200 SMA at $2,71. Consequently, its RSI approached the oversold region. Any close below the 30-mark might be in for a trend reversal.


