Solana, thank Jupiter? How JUP may have come to SOL’s rescue in Q1
Solana’s monthly fee and revenue hit new highs in March as its DEX activity spiked.

- Jupiter recorded the most daily users in Q1
- SOL demand cratered on the back of its price decline
Solana-based decentralized exchange (DEX) Jupiter [JUP] closed Q1 as the DeFi protocol with the highest count of daily unique active wallets over a 90-day period. This, according to DappRadar’s latest report.
In its newly published “State of the Dapp Industry Q1 2024” report, it found that the DEX’s daily unique active wallet count totalled 179,000. This was due to the memecoin frenzy that saw the values of some Solana-based assets such as dogwifhat [WIF] and Book of Meme [BOME] skyrocket by triple digits.
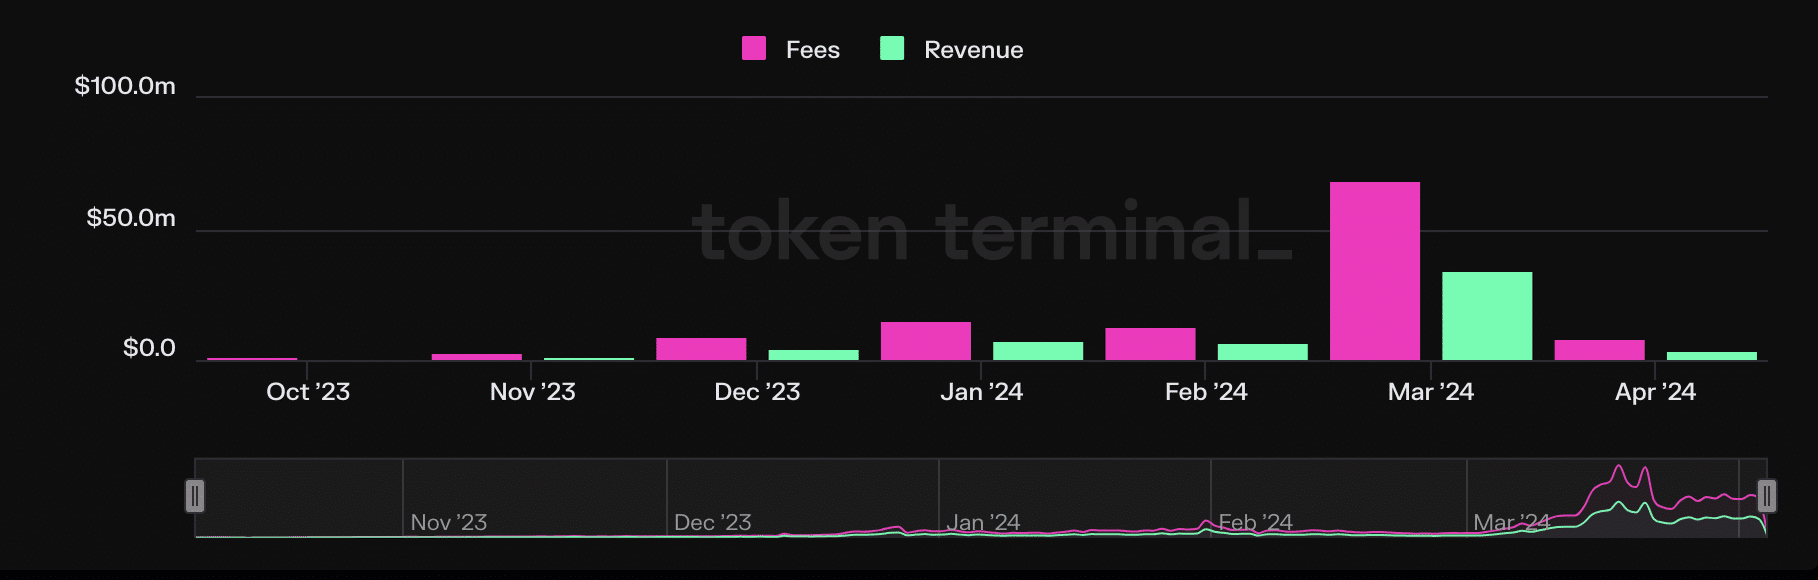
Solana gained from increased user activity on Jupiter, as its transaction fees and revenue derived from the same spiked.
According to Token Terminal’s data, monthly transaction fees on Solana hit an all-time high of $69 million in March. This represented a 360% uptick in monthly transaction fees on the network in the year’s first quarter.
Likewise, protocol revenue derived by Solana from these fees also surged. Towards the end of March, it totalled $34 million. This marked a 389% spike in Solana’s monthly revenue from the $7 million-figure it saw in January.
A show of strength
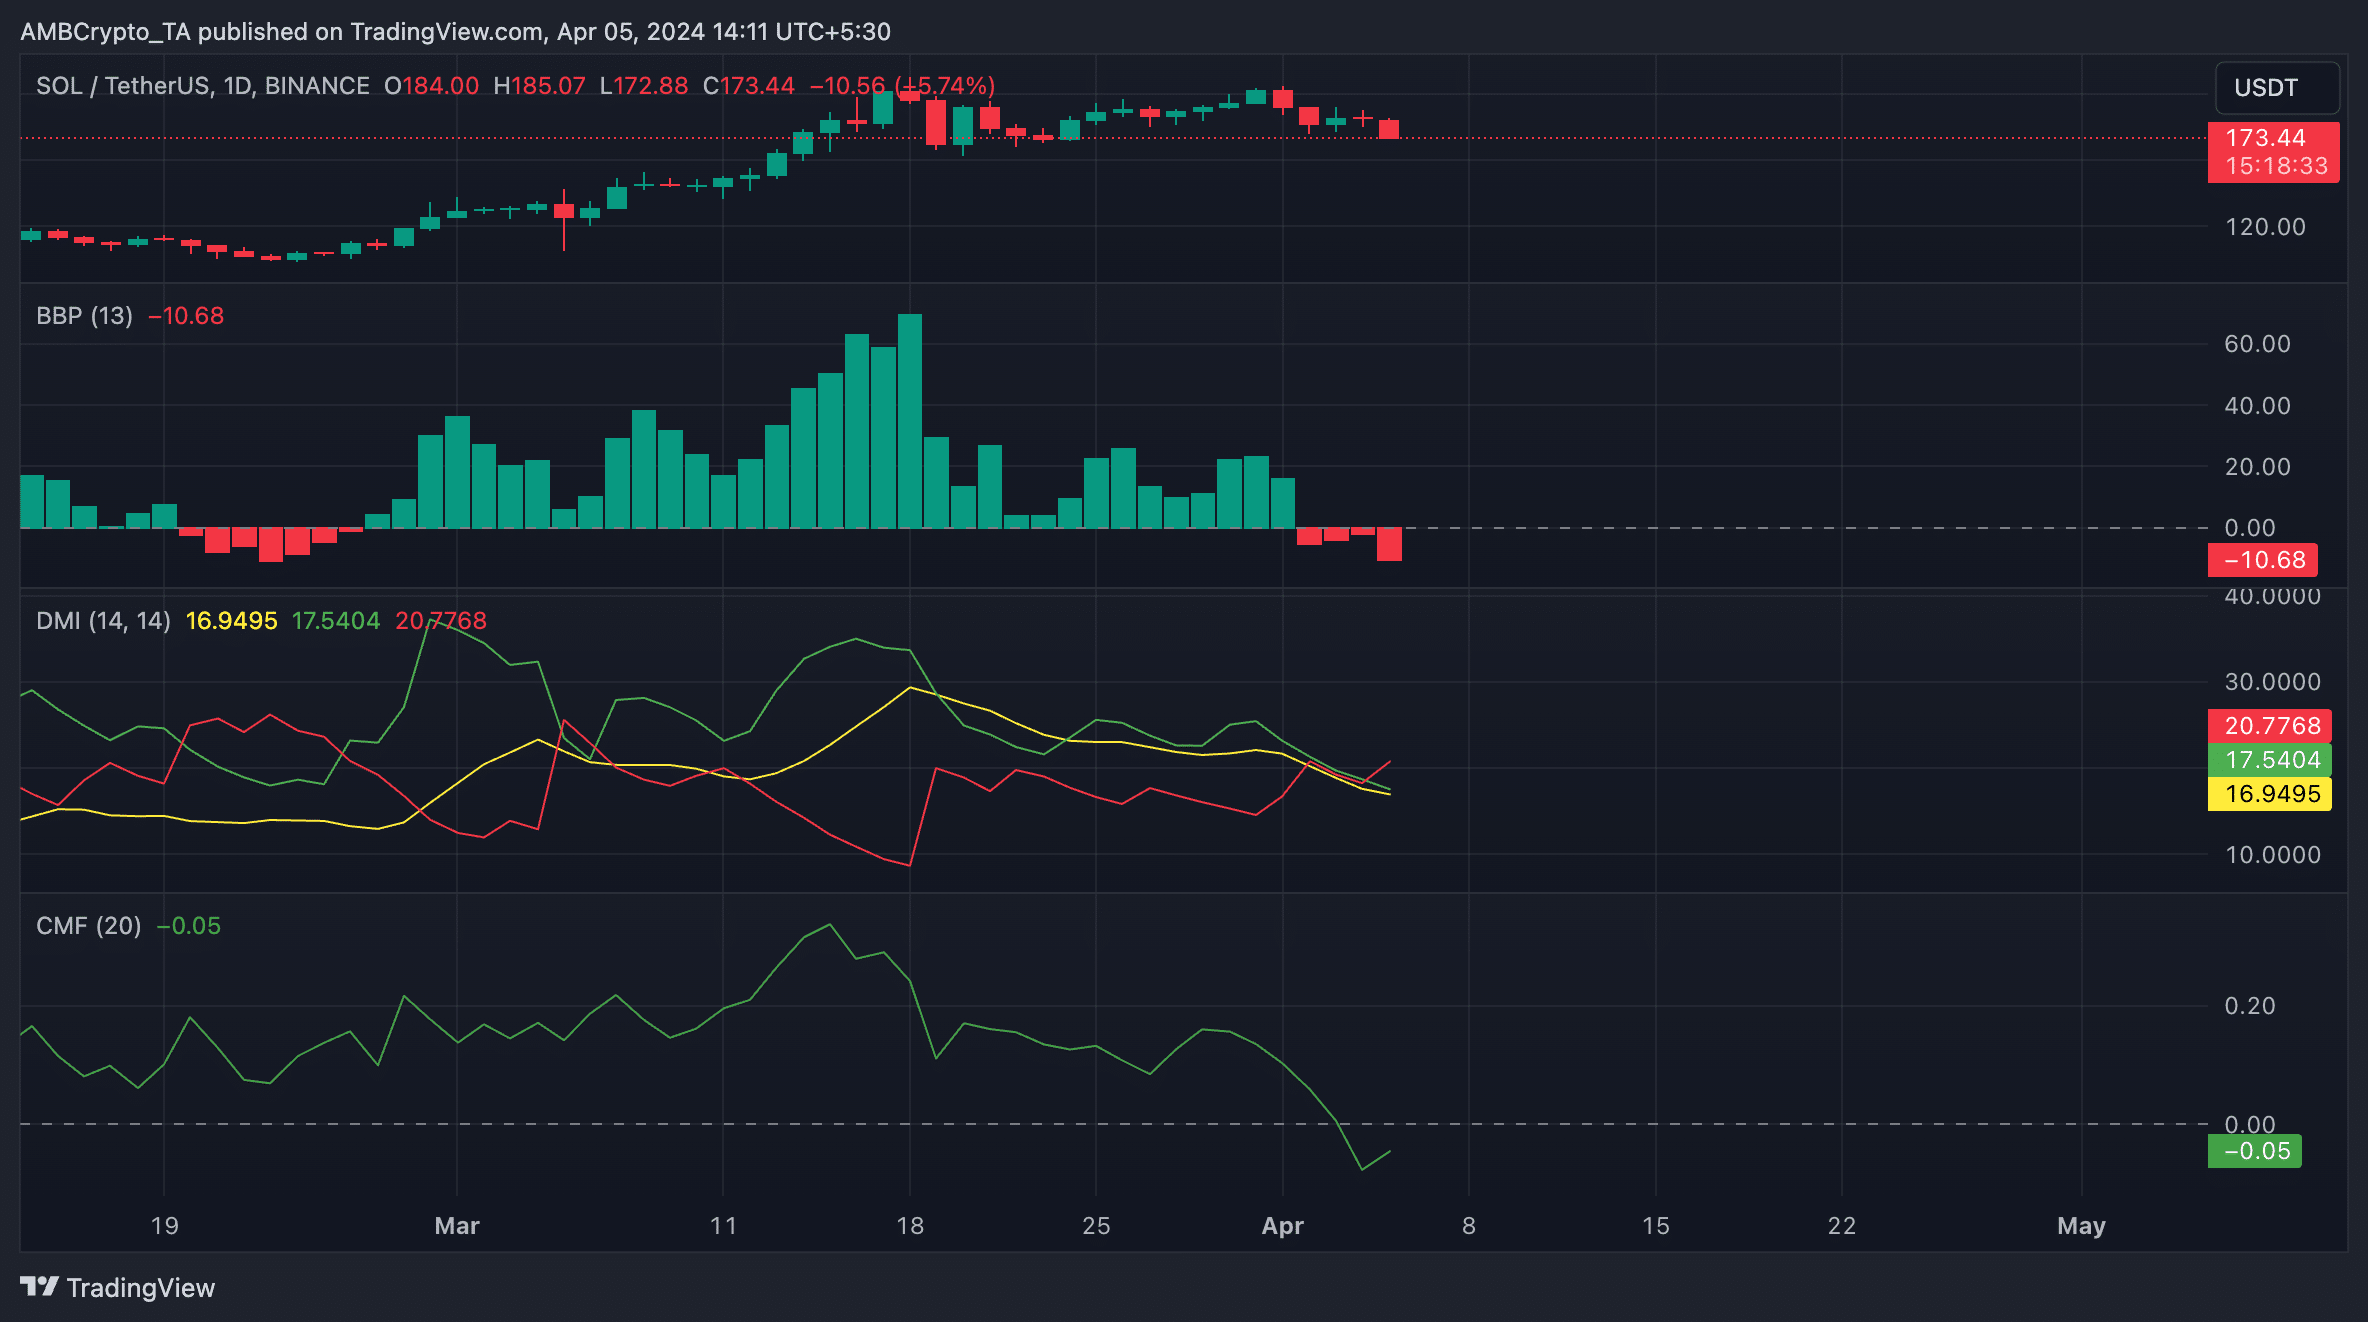
Following an extended period of relinquishing control to the bulls, SOL bears have re-emerged to initiate a decline in the altcoin’s price. Trading at $175 at press time, SOL’s price has fallen by 5% in the last week alone.
Realistic or not, here’s SOL’s market cap in BTC’s terms
Signaling the spike in bearish sentiment, SOL’s Elder-Ray Index returned a negative value at press time. This indicator estimates the relationship between the strength of buyers and sellers in the market. When its value is negative, it means that the selling pressure in the market is stronger than the buying pressure.
Likewise, AMBCrypto’s readings from the coin’s Directional Movement Index (DMI) showed its positive directional index (green) resting below its negative index (red). When these lines are positioned this way, it means that the bear power in the market exceeds the bull power. It indicates that the selling pressure is high, and the asset in question may see further price decline.
Finally, SOL’s Chaikin Money Flow (CMF) at -0.04 revealed that the demand for the altcoin was low on the charts. This indicator measures the flow of money into and out of an asset. When its value is negative, it indicates a weak market.