Solana, Theta, MATIC Price Analysis: 16 May

Solana’s rise above its sloping trendline fueled strong buying behavior and a breakout above $49.6 could trigger an extended rally. THETA remained between $12.4 and 8.4 while its technicals indicated the lack of a strong trend. Lastly, a correction seemed likely for MATIC before resuming its northbound trajectory.
Solana [SOL]
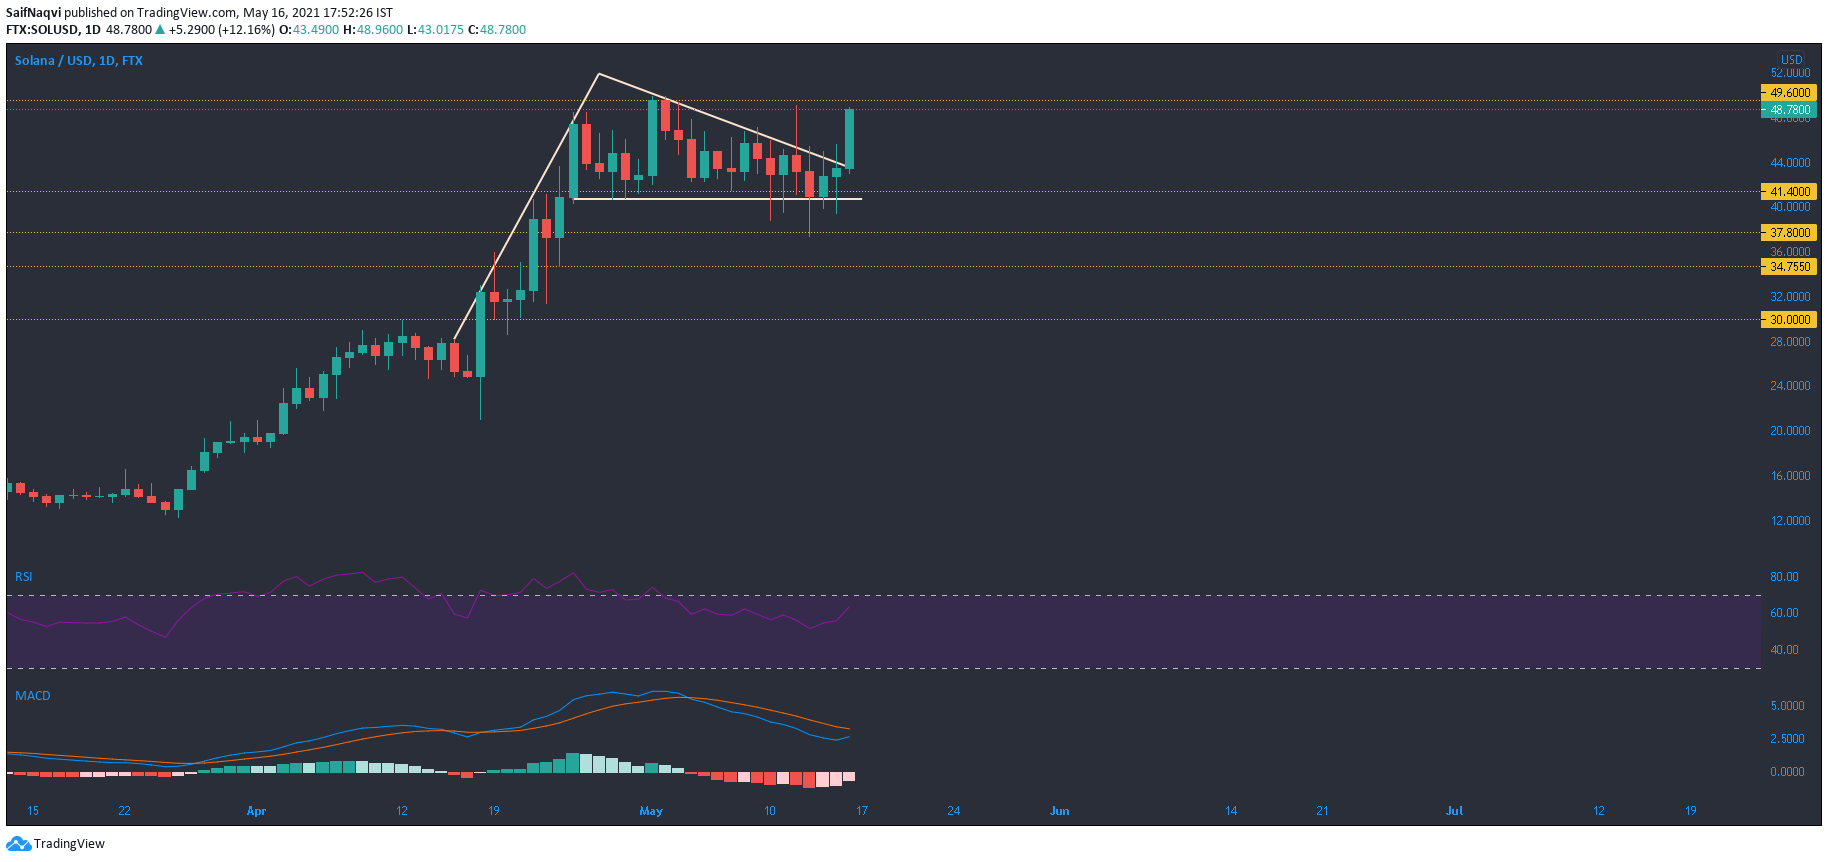
A breakout above the upper sloping trendline showed gains of 14% as Solana was quite bullish at the time of writing. Since the breakout occurred on strong volumes, SOL made a strong case for trending in the upward direction but there lay some resistance around $49.6. A jump above this upper ceiling could result in an extended buy scenario.
RSI traded in the bullish territory around 60, while MACD line closed in on the Signal line. A successful crossover could result in another bull run moving forward. If a move above $49.6-resistance is denied, consolidation would be likely.
THETA

Since the start of May, THETA has largely traded between the channel $12.4-8.4. Meanwhile, ADX has gradually made lower highs as the market has become less directional. At press time, ADX floated around 17 and highlighted a weak trend. Since trading volumes were also muted across exchanges since mid-April, sharp movements have been rare.
MACD floated below half-line as THETA slipped below its 20-SMA (blue) and 50-SMA (yellow) on the daily timeframe. Support levels rested at $6.4 and $4.8 in case of another breakdown. A dip towards the latter level could present buy opportunities for long-term traders.
MATIC
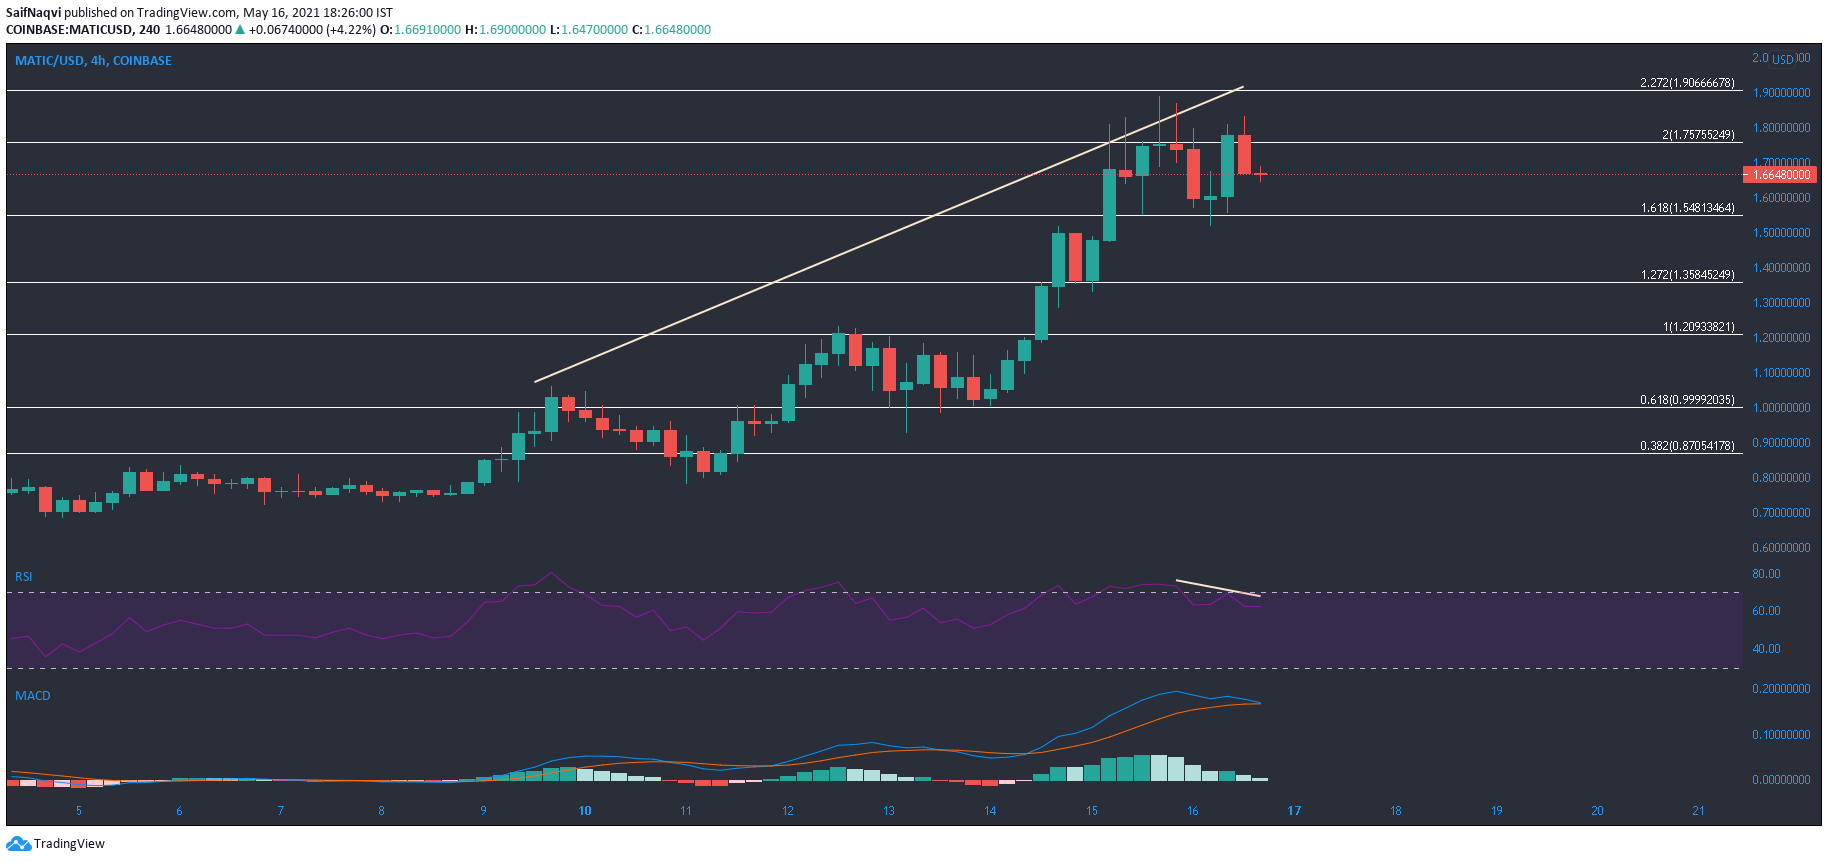
The 4-hour chart noted some selling volume as MATIC traded above the 161.8% Fibonacci Extension level. However, targets mentioned in a previous analysis were yet to be realized and a 14% dip in trading volumes suggested weakening.
RSI showed a bit of a bearish divergence with the price as it formed two lower peaks and moved south from the overbought territory. Pullbacks can be countered at $1.54 or $1.3, but a stronger buy zone lay around $1.0 and close to the 50-SMA (yellow). MACD closed in on a bearish crossover, suggesting that MATIC’s impressive bull run was coming to an end.