- SOL has declined by 15.83% over the last 30 days
- Analysts believe a rebound may be incoming based on 3 previous breakpoint cycles
Solana [SOL], the fifth largest cryptocurrency by market cap, has seen some extreme volatility in 2024. After enjoying a steady rise in 2023, the so-called ETH killer has failed to maintain its upward momentum this year.
This shift in market sentiment has seen the altcoin’s price decline by 40% on the charts, from its $209 ATH recorded in March.
In fact, at the time of writing, SOL was trading at $130.13 after a 5.95% decline over the past week. This sustained decline is a sign of growing lack of confidence among investors.
Despite the scale of this downside though, analysts like Ali Martinez are expecting an upcoming rebound.
What do the market sentiments suggest?
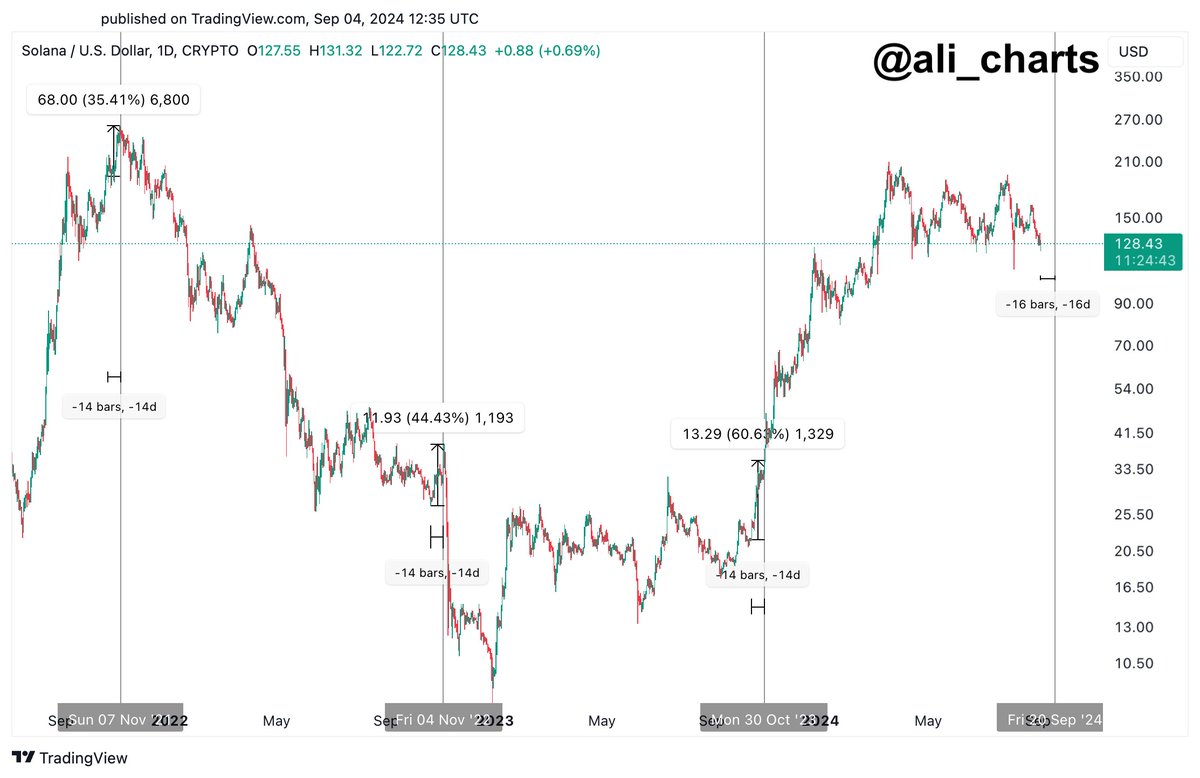
According to the popular crypto analyst, SOL might soon see an uptrend based on its historical cycle. Martinez claimed the TD sequential indicator underlined a key buy signal on SOL’s daily charts. He also cited the 3 previous cycles before Solana’s Breakpoint, arguing that each cycle from 2021 to 2023 saw a price upswing.
His observations on X stated,
“Historically, two weeks before the #Solana Breakpoint, $SOL tends to see a price upswing. In 2021, it surged by 35%, in 2022 by another 35%, and in 2023 by 60%. Now, we’re 16 days away from the 2024 #SOL Breakpoint event.”
Source: X
Based on this analysis, SOL’s price might start an uptrend pretty soon.
Equally, the TD sequential indicator highlighted the end of a certain trend based on market behavior. Simply said, this indicator can be expected to soon flash a buy signal, indicating a potential upward reversal after a downtrend.
What do the charts say?
While an analysis based on previous cycles might be compelling, what do SOL’s charts say?
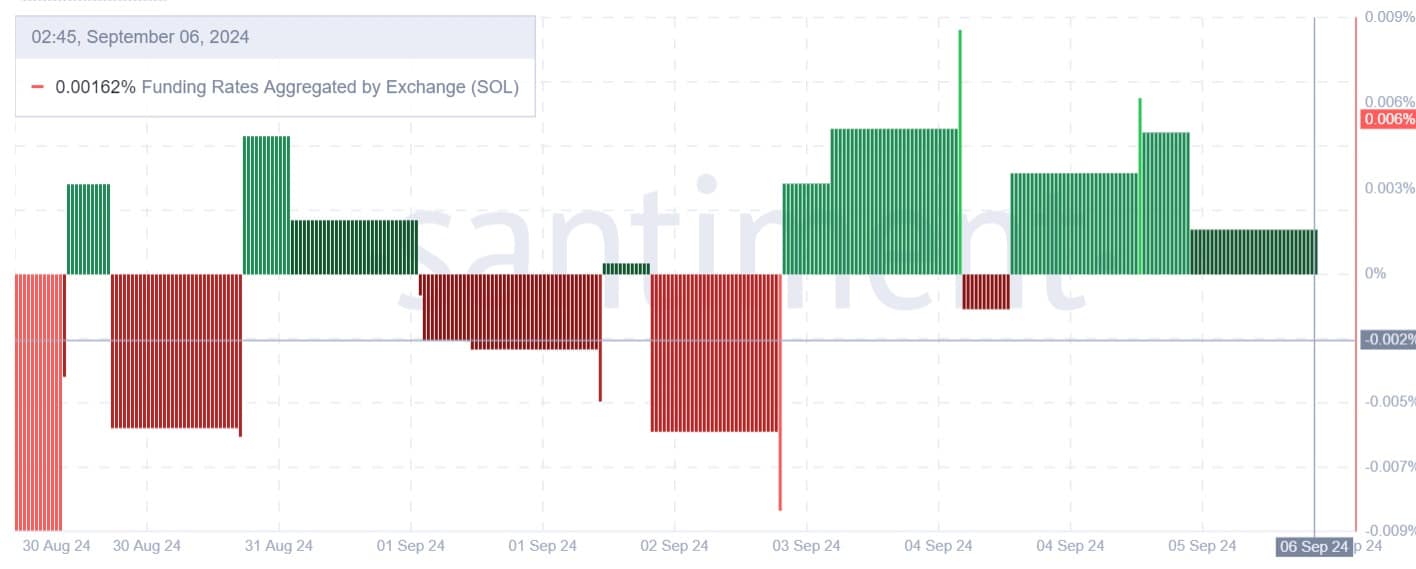
Source: Santiment
For starters, Solana’s funding rate aggregated by exchange has remained positive for the last 3 days. Although the price has declined during this period, investors have shown confidence in the altcoin’s direction.
Therefore, long positions are paying short positions to hold their position. This means traders may be betting on the prices to rise and thus are willing to pay a premium for their positions. This can be interpreted as a bullish signal.
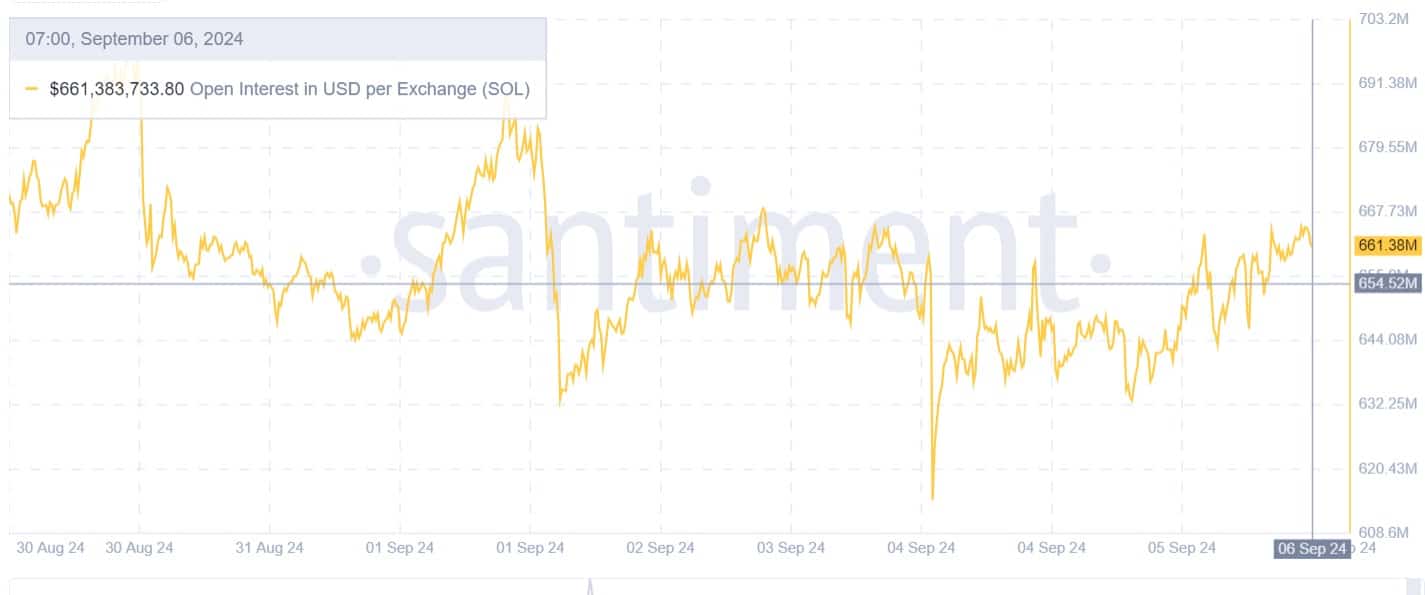
Source: Santiment
Additionally, Open Interest per exchange rose by 7.59% over the past week from a low of $614 million to $661 million. This underlined a hike in buying activity, with investors opening new positions while others hold the existing ones – Another positive market sentiment.
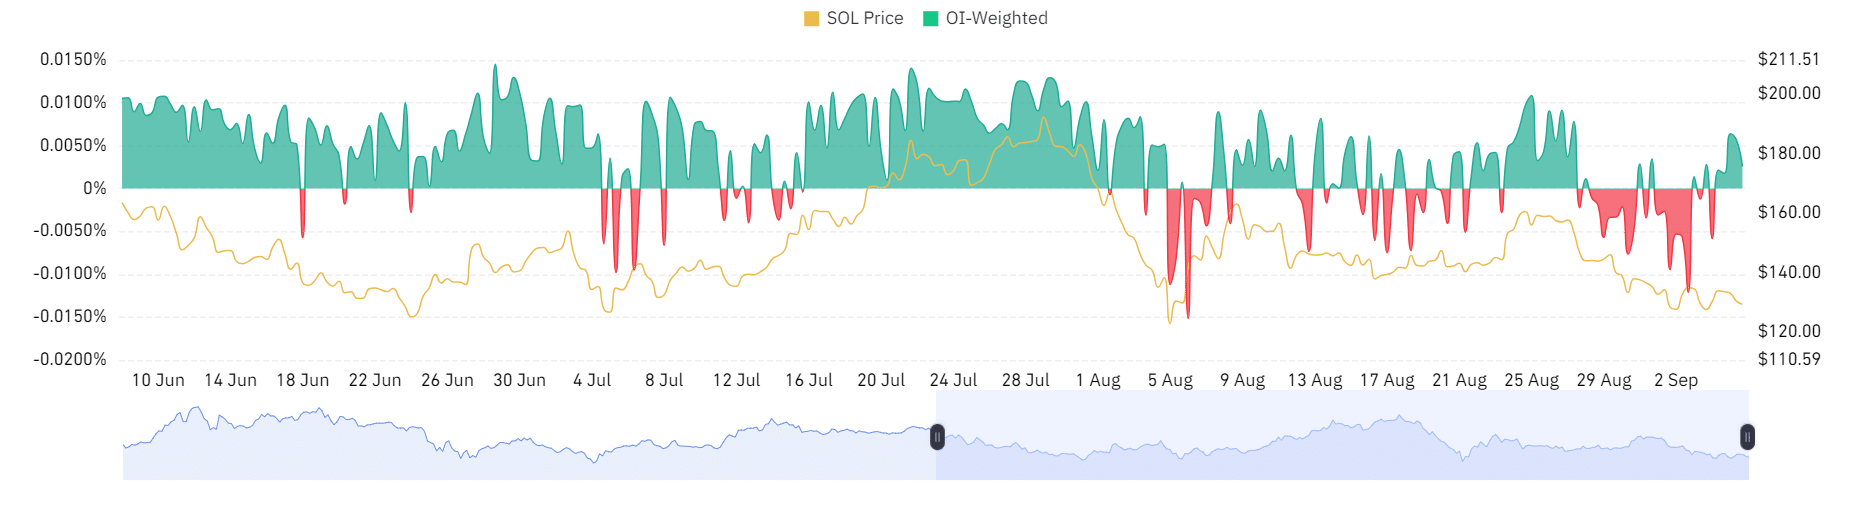
Source: Coinglass
Finally, from 3-6 September 2024, the OI-weighted funding rate has remained positive. This is a sign of increased demand for long positions. Such market condition can be used to highlight investor’s confidence in the altcoin.
Therefore, if Martinez’s analysis turns out to be right, coupled with the positive market sentiment, SOL can note a short-term rebound to $142.