Solana, Tron, Stellar Price Analysis: 13 January

With Bitcoin closing in above all its 4-hour EMA ribbons, altcoins like Solana, Tron, and Stellar fought the bears with all their might. Their near-term technicals depicted the increasing buying momentum as they reclaimed their lost support levels.
Solana (SOL)
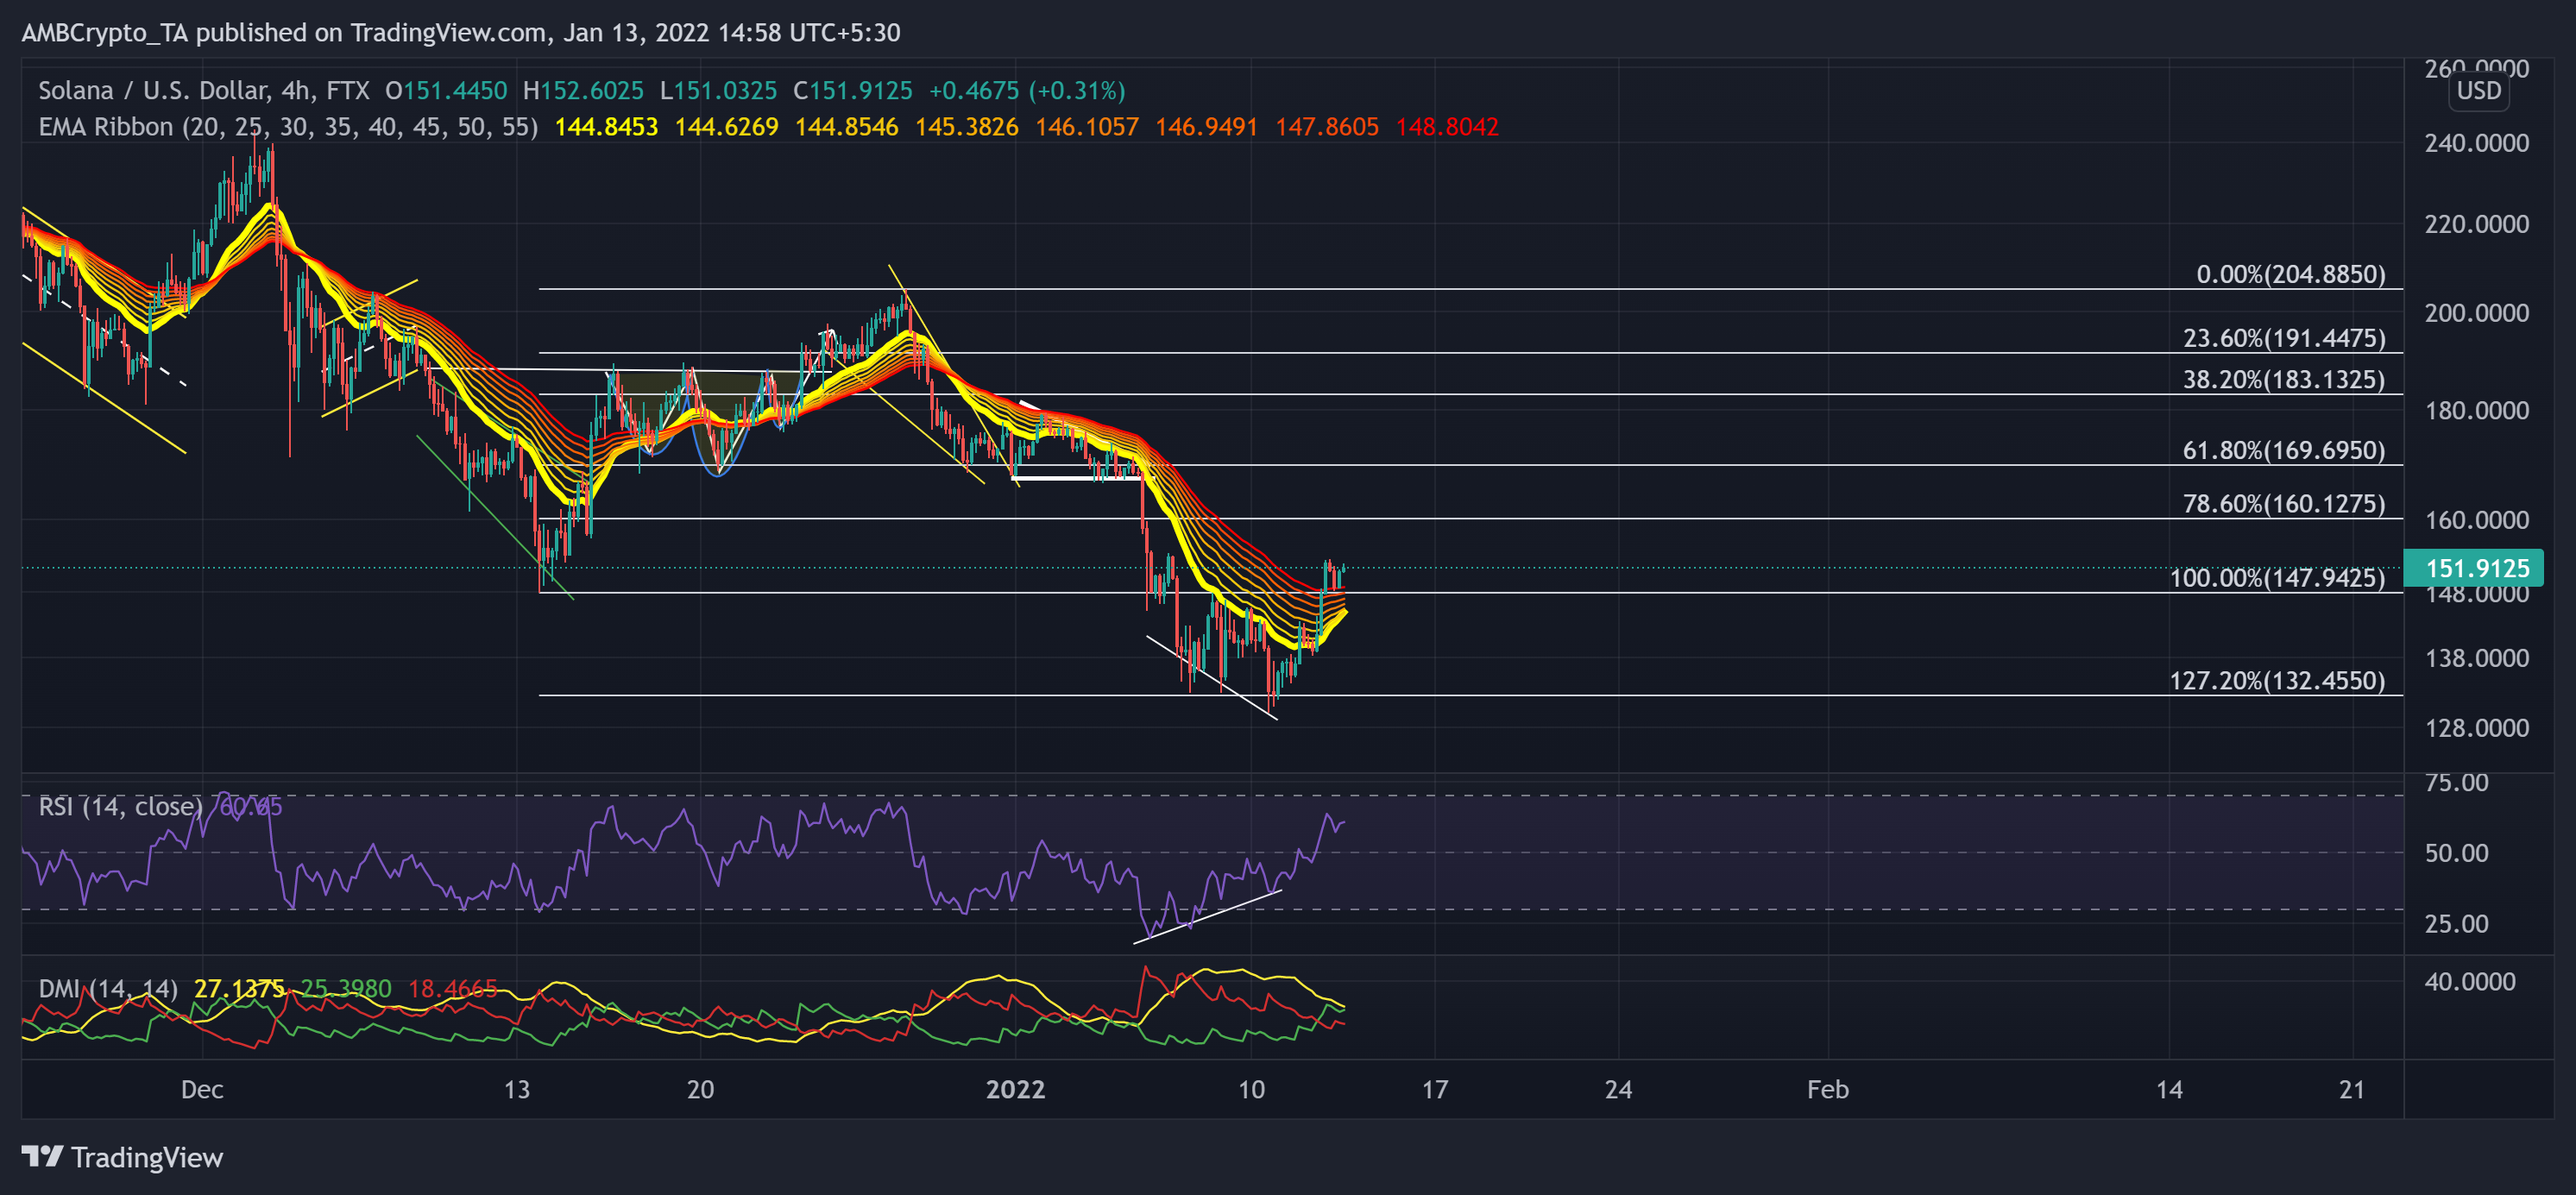
The 5 January sell-off fueled SOL’s already existing bearish tendencies since late December as the alt saw a descending triangle (white) breakout.
While the buyers failed to step in, the alt saw an over 23% retracement (from 5 January) until it poked its 15-week low on 10 January.
The alt fell below its 61.8%, 78.6%, Fibonacci support and tested the $132-mark multiple times. The 16% rise over the past three days led SOL to cross all its EMA ribbons and test the 55-EMA (red) as its immediate support. As the gap between the ribbons lessened, the buying influence heightened.
At press time, the alt traded at $151.9125. The RSI witnessed mounting gains after a bullish divergence with the price. Also, the DMI showed a bullish preference while the ADX was on a downtrend.
Tron (TRX)
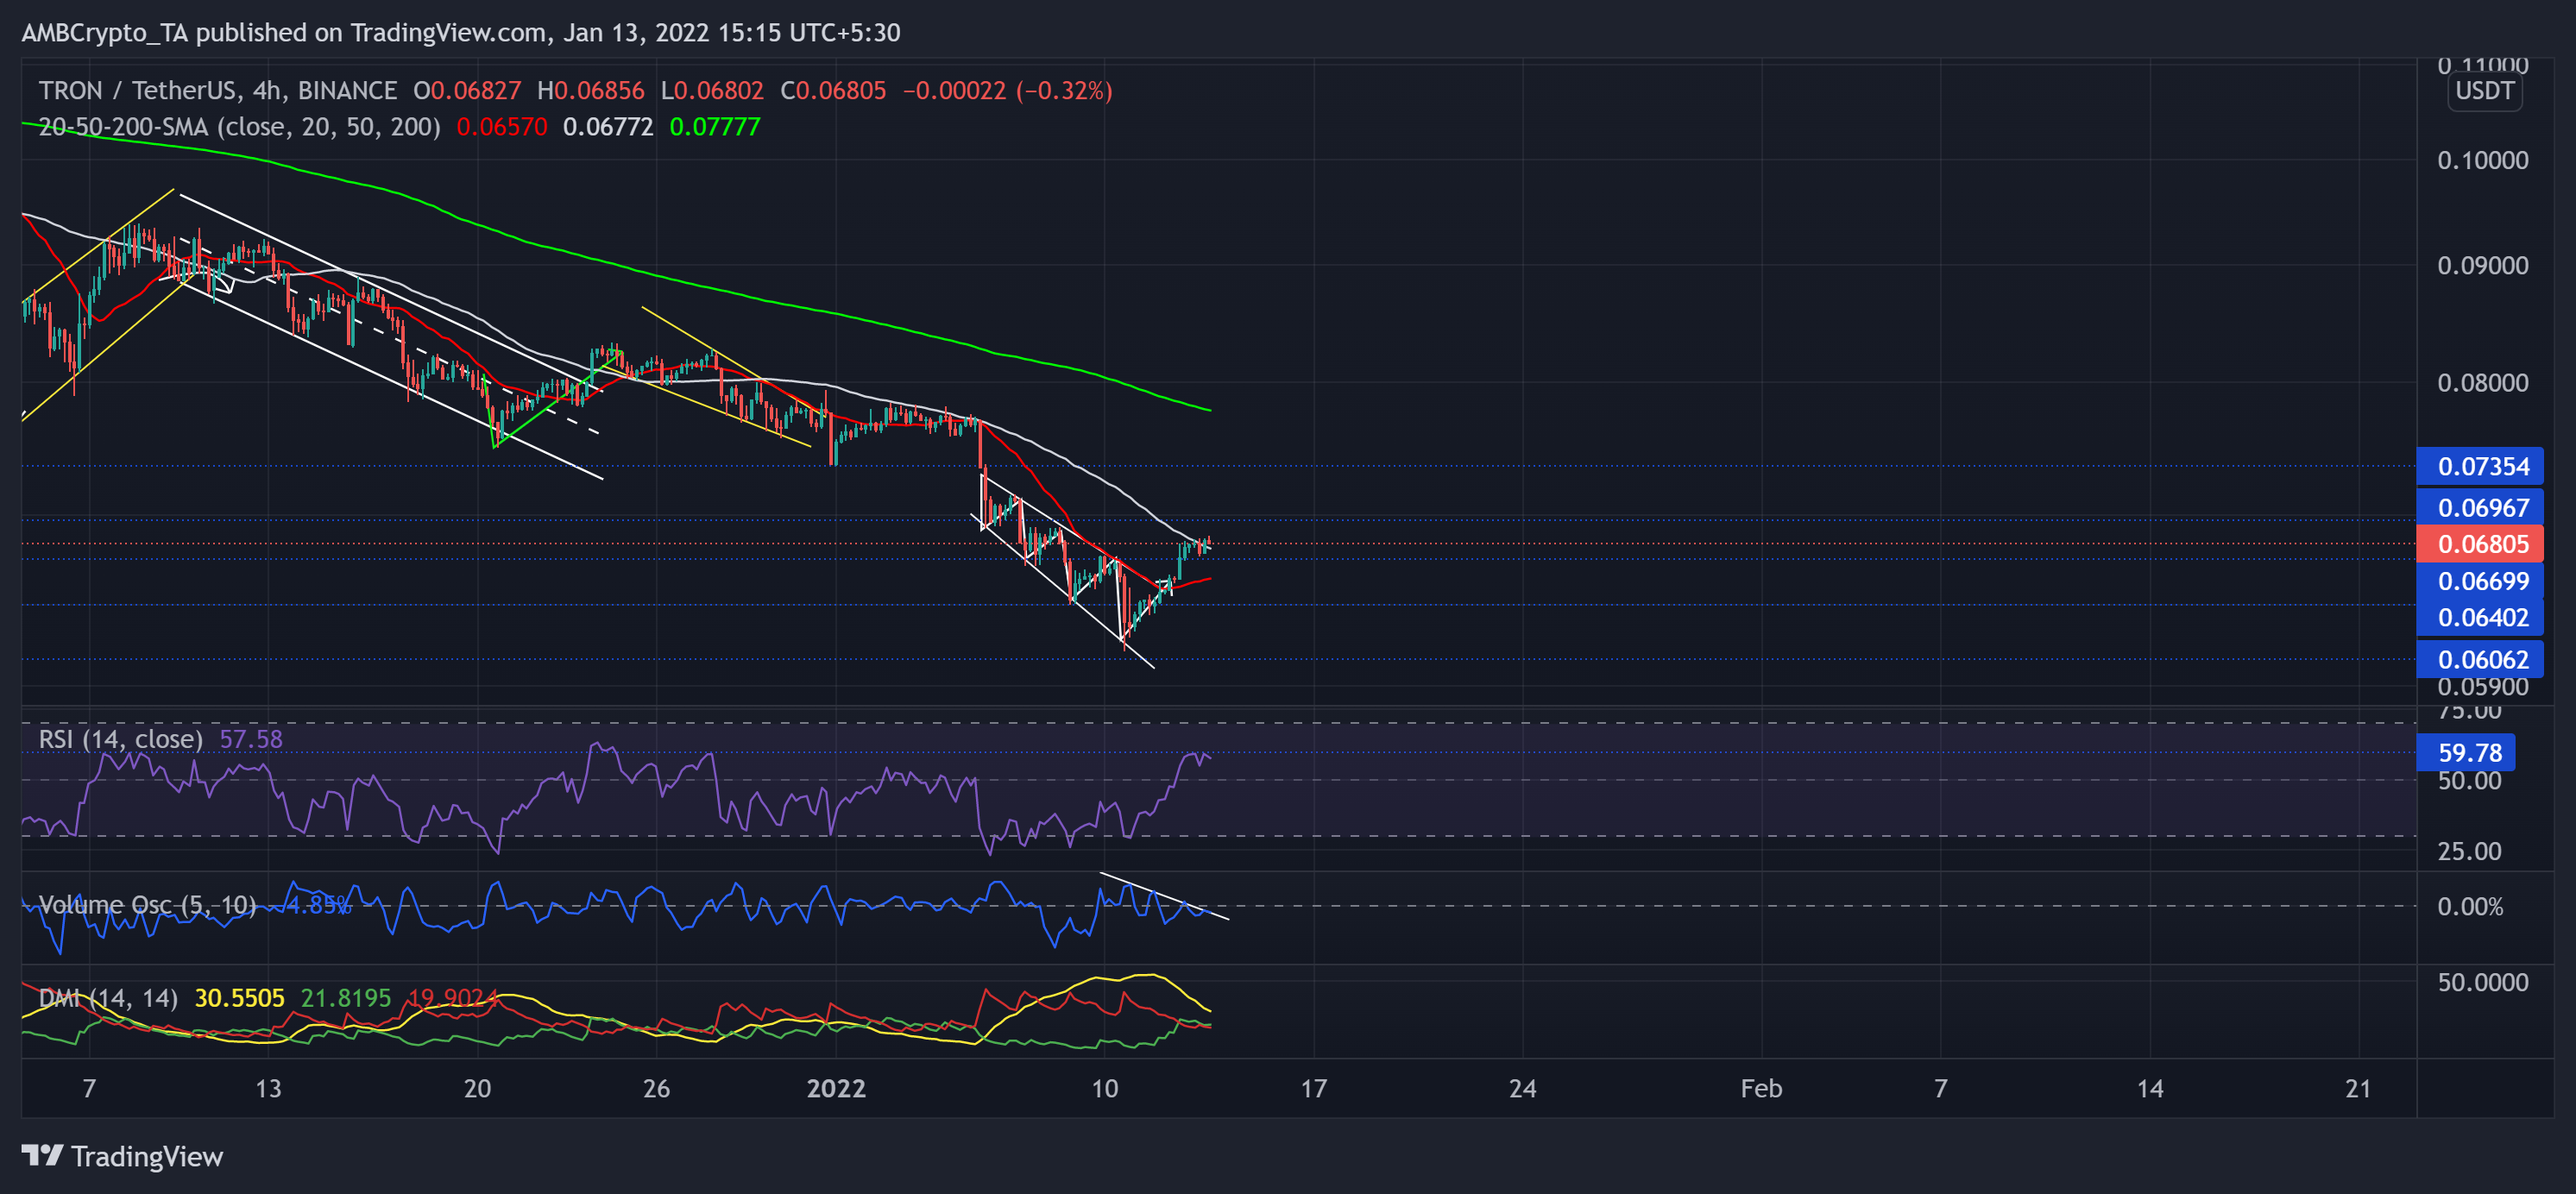
The buyers failed to step in as TRX withdrew by nearly 20.82% (from 5 January) and poked its five-month low on 10 January.
The king coins recovery made way for TRX to initiate an 11.7% descending broadening wedge (white) breakout. With this jump, the alt found a close above its 20-50 SMA.
Now, the immediate resistance stood at the $0.06967-mark after the bulls reclaimed the $0.0669-level support.
At press time, TRX traded at $0.06805. The RSI finally broke out midline hurdle and tested the 59-mark resistance twice over the last day. Although the DMI slightly skewed in favor of bulls, the Volume Oscillator rather suggested a weak bullish move.
Stellar (XLM)
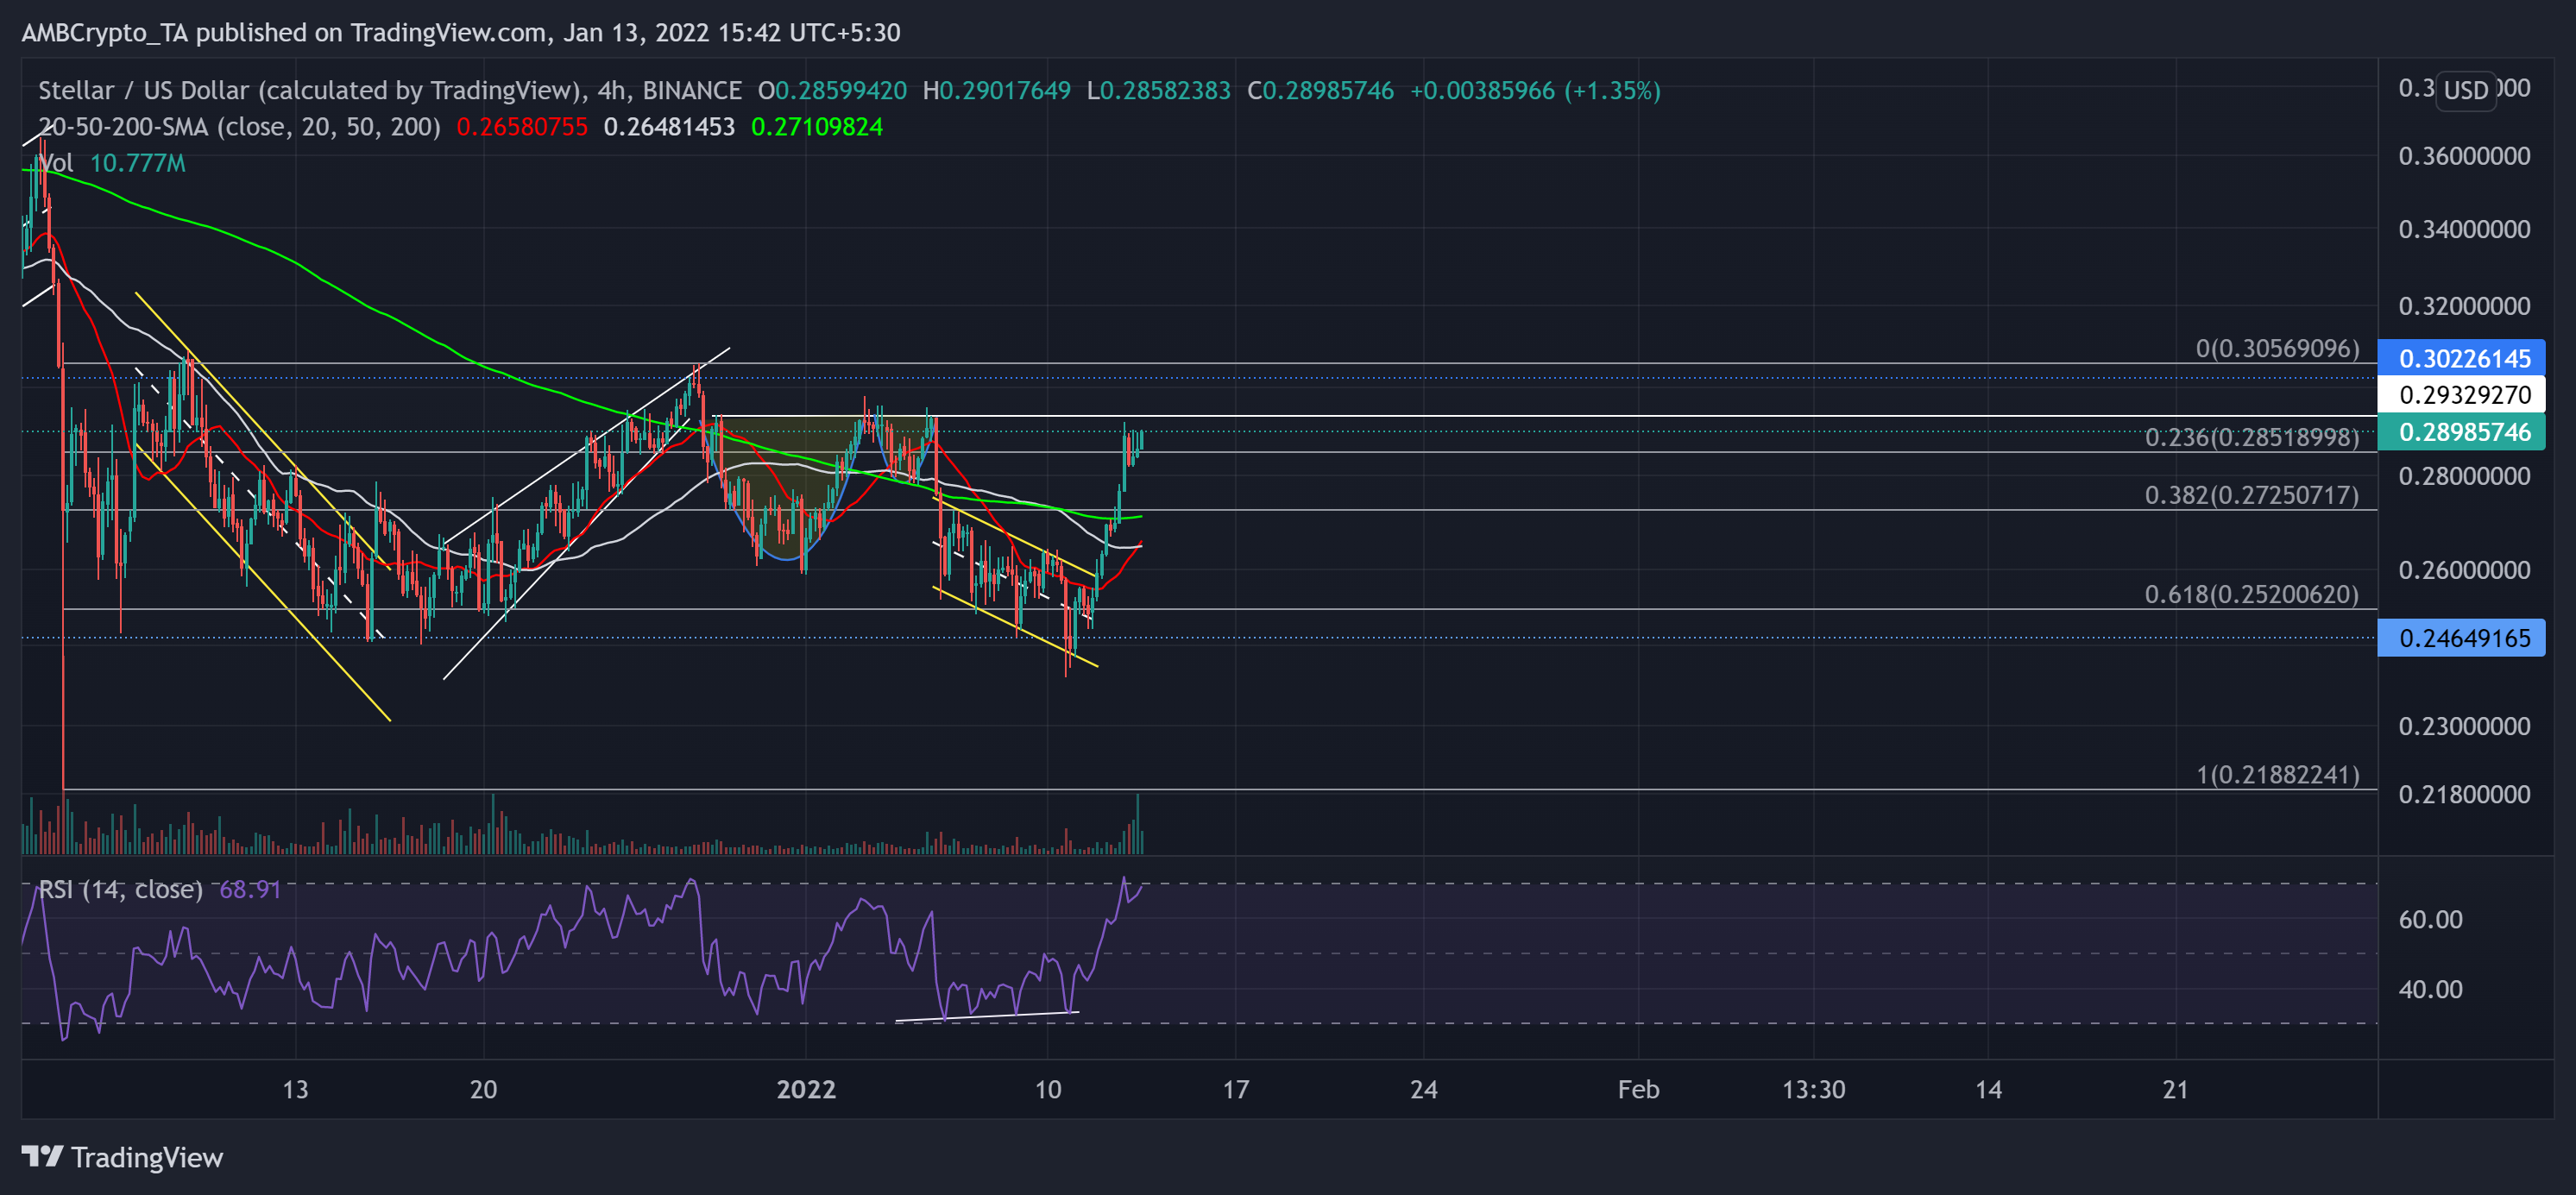
Since the up-channel (white) breakdown on 3 December, XLM lost nearly one-third of its value but ensured the 24-week support at the $0.2464-level. Consequently, it rose in a rising wedge (white) to find test the $0.3022-mark resistance.
Then, the broader sell-off invalidated the bullish cup and handle pattern as XLM withdrew in a down-channel (yellow). As a result, it touched its five-week low on 10 January.
After again testing the $0.2464-mark, the alt broke out of the pattern after an over 21% ROI in just three days. Thus, also ensuring that the 61.8% support is intact.
Now, the $0.2932-level would be a point where sellers will have to step in to prevent a sustained breakout. At press time, XLM traded above its 20-50-200 SMA at $0.28986. The RSI was near the overbought region and undeniably chose the bulls.