Solana, VeChain, Ethereum Classic Price Analysis: 06 February

While the overall market sentiment seemingly improved, Solana, VeChain, and Ethereum Classic continued their up-channel oscillation. Their near-term technicals flashed a bullish preference, but the same seemed to slow down in the near term after testing the overbought region.
Solana (SOL)

Since breaking down from the $167-mark on 5 January, SOL bears accelerated their pressure by initiating multiple sell-offs. SOL noted a 52.2% loss (from 5 January) and touched its five-month low on 24 January.
Over the last two weeks, the altcoin has witnessed an ascending channel on its 4-hour chart. The past two days marked notable gains after SOL bounced back from the lower trendline of the lower band of the Bollinger Bands (BB). It saw an over 24% jump but later seemingly slowed down as it approached the upper band of the BB.
Further retracements from here would again find a testing floor near the midline of the up-channel.
At press time, SOL was trading at $113.165. The RSI rapidly grew after breaching the 43-mark. It tested the overbought region multiple times over the past week. Now, it may be possibly eyeing a retest of the 56-mark support.
VeChain (VET)
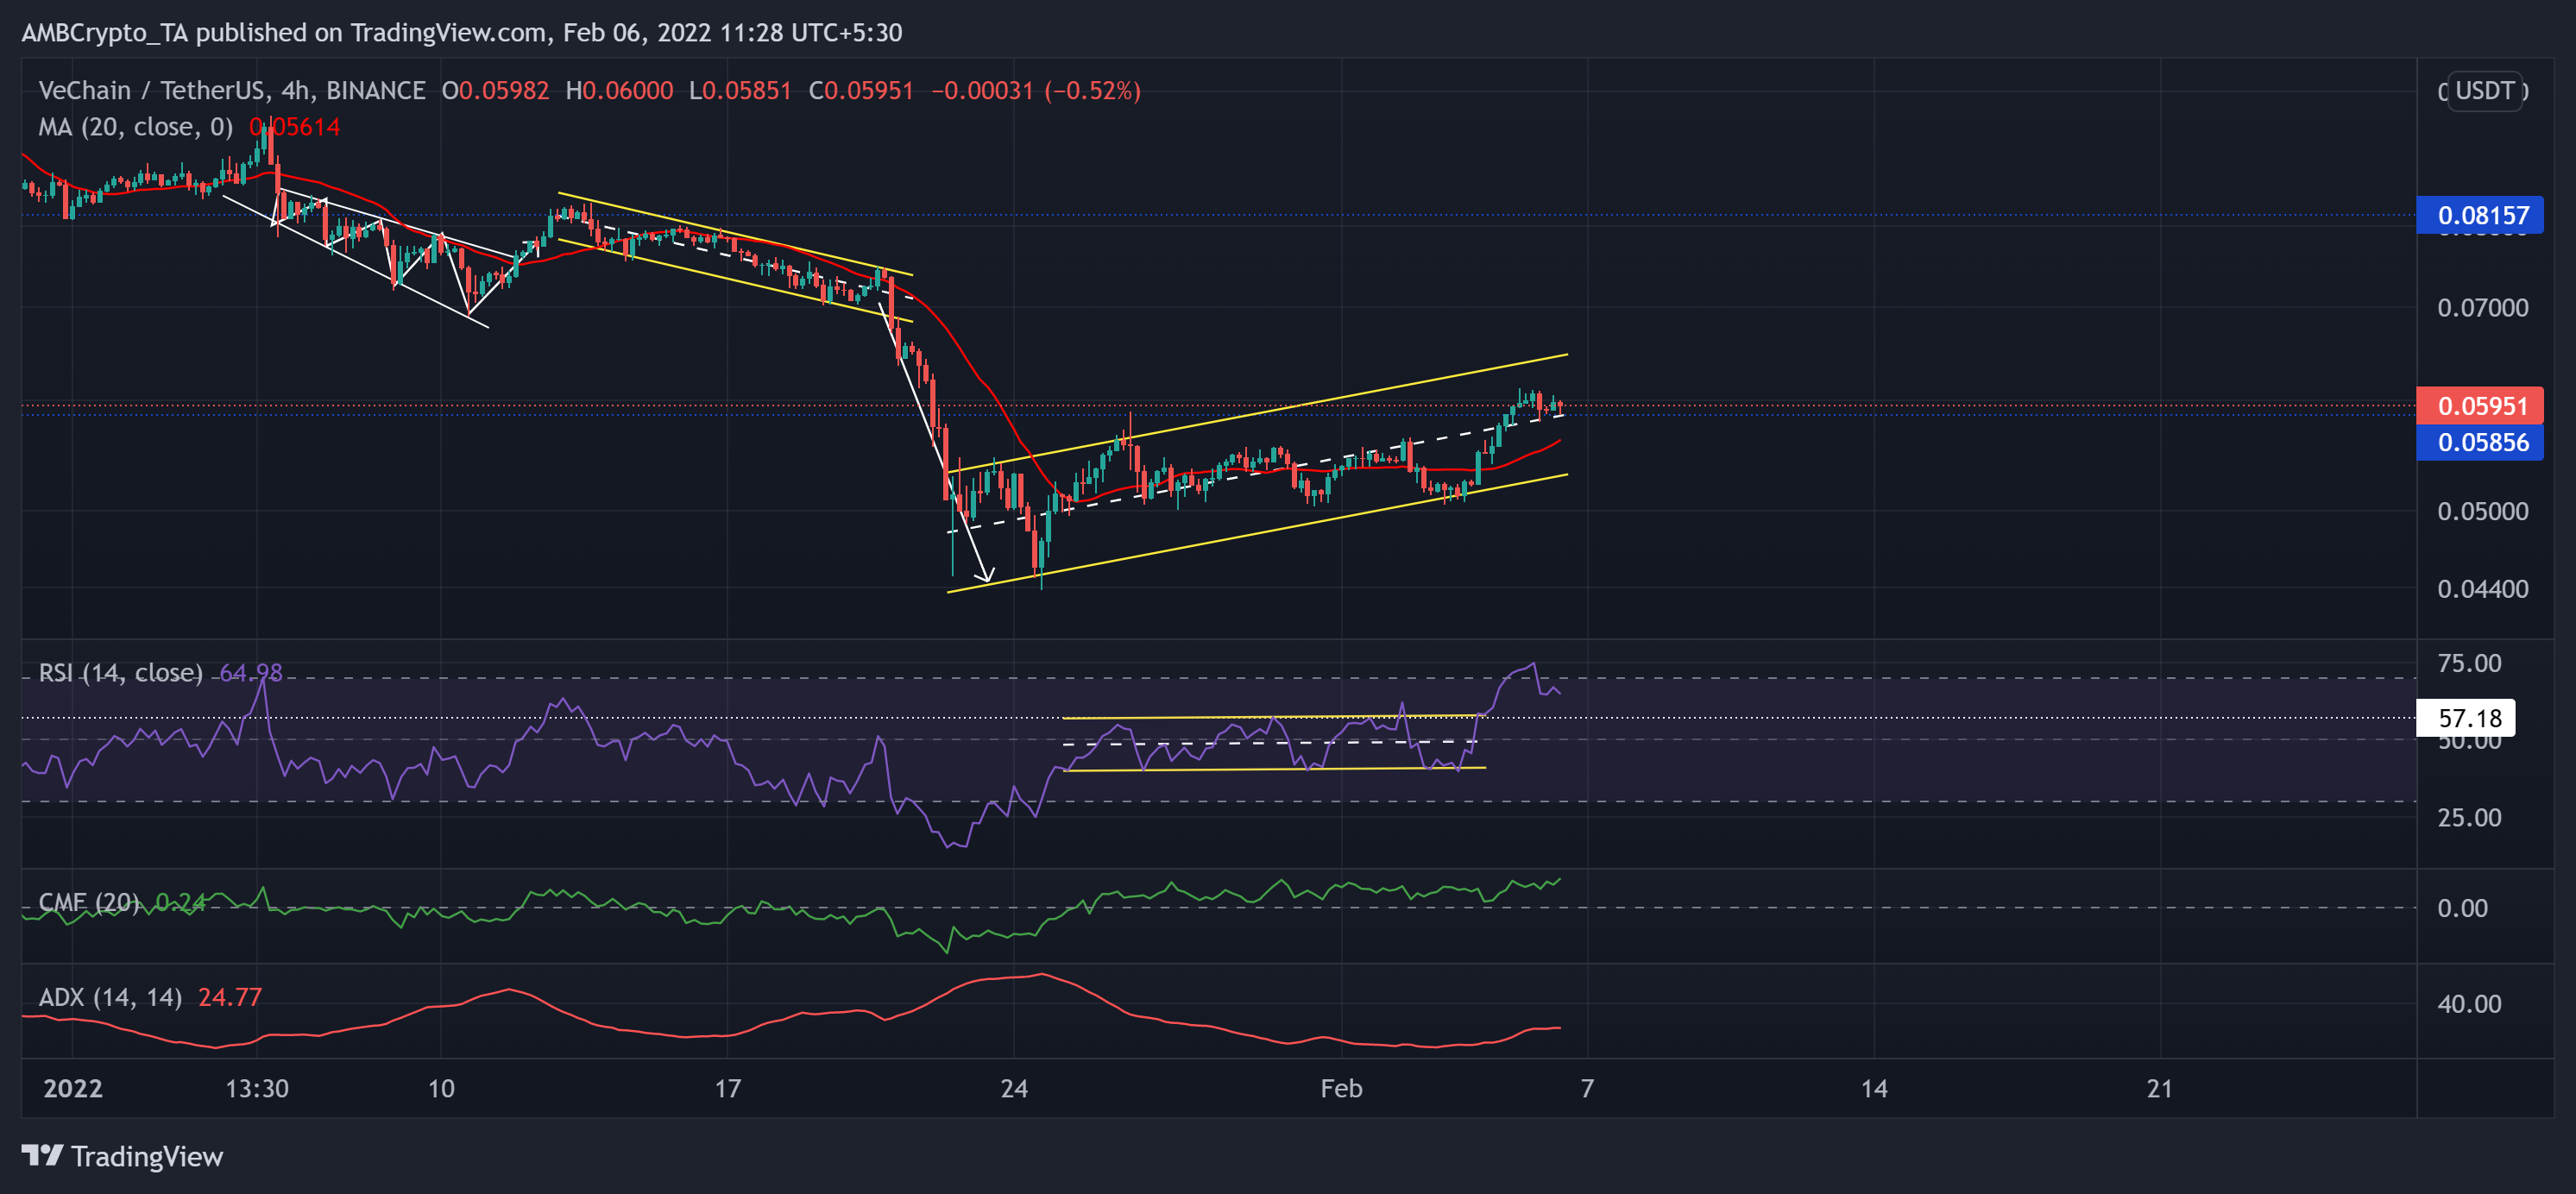
VET lost 54.15% of its value (from 5 January) and fell toward its 11-month low on 24 January. Over the past few days, VET formed a down channel (yellow) on its 4-hour chart.
Now, the bulls found it challenging to test the upper trendline of the up-channel (yellow). Any close below the $0.0585-level would propel a retest of the 20 SMA (red).
At press time, VET traded at $0.05951. The RSI moved between two horizontal trendlines for ten days. Following the same, it witnessed a rectangle top breakout. It pictured a bullish bias while heading to test the 57-support. Also, the CMF reaffirmed the bullish edge while being above the zero-line since 26 January. Nevertheless, the ADX displayed a slightly weak directional trend for the alt.
Ethereum Classic (ETC)
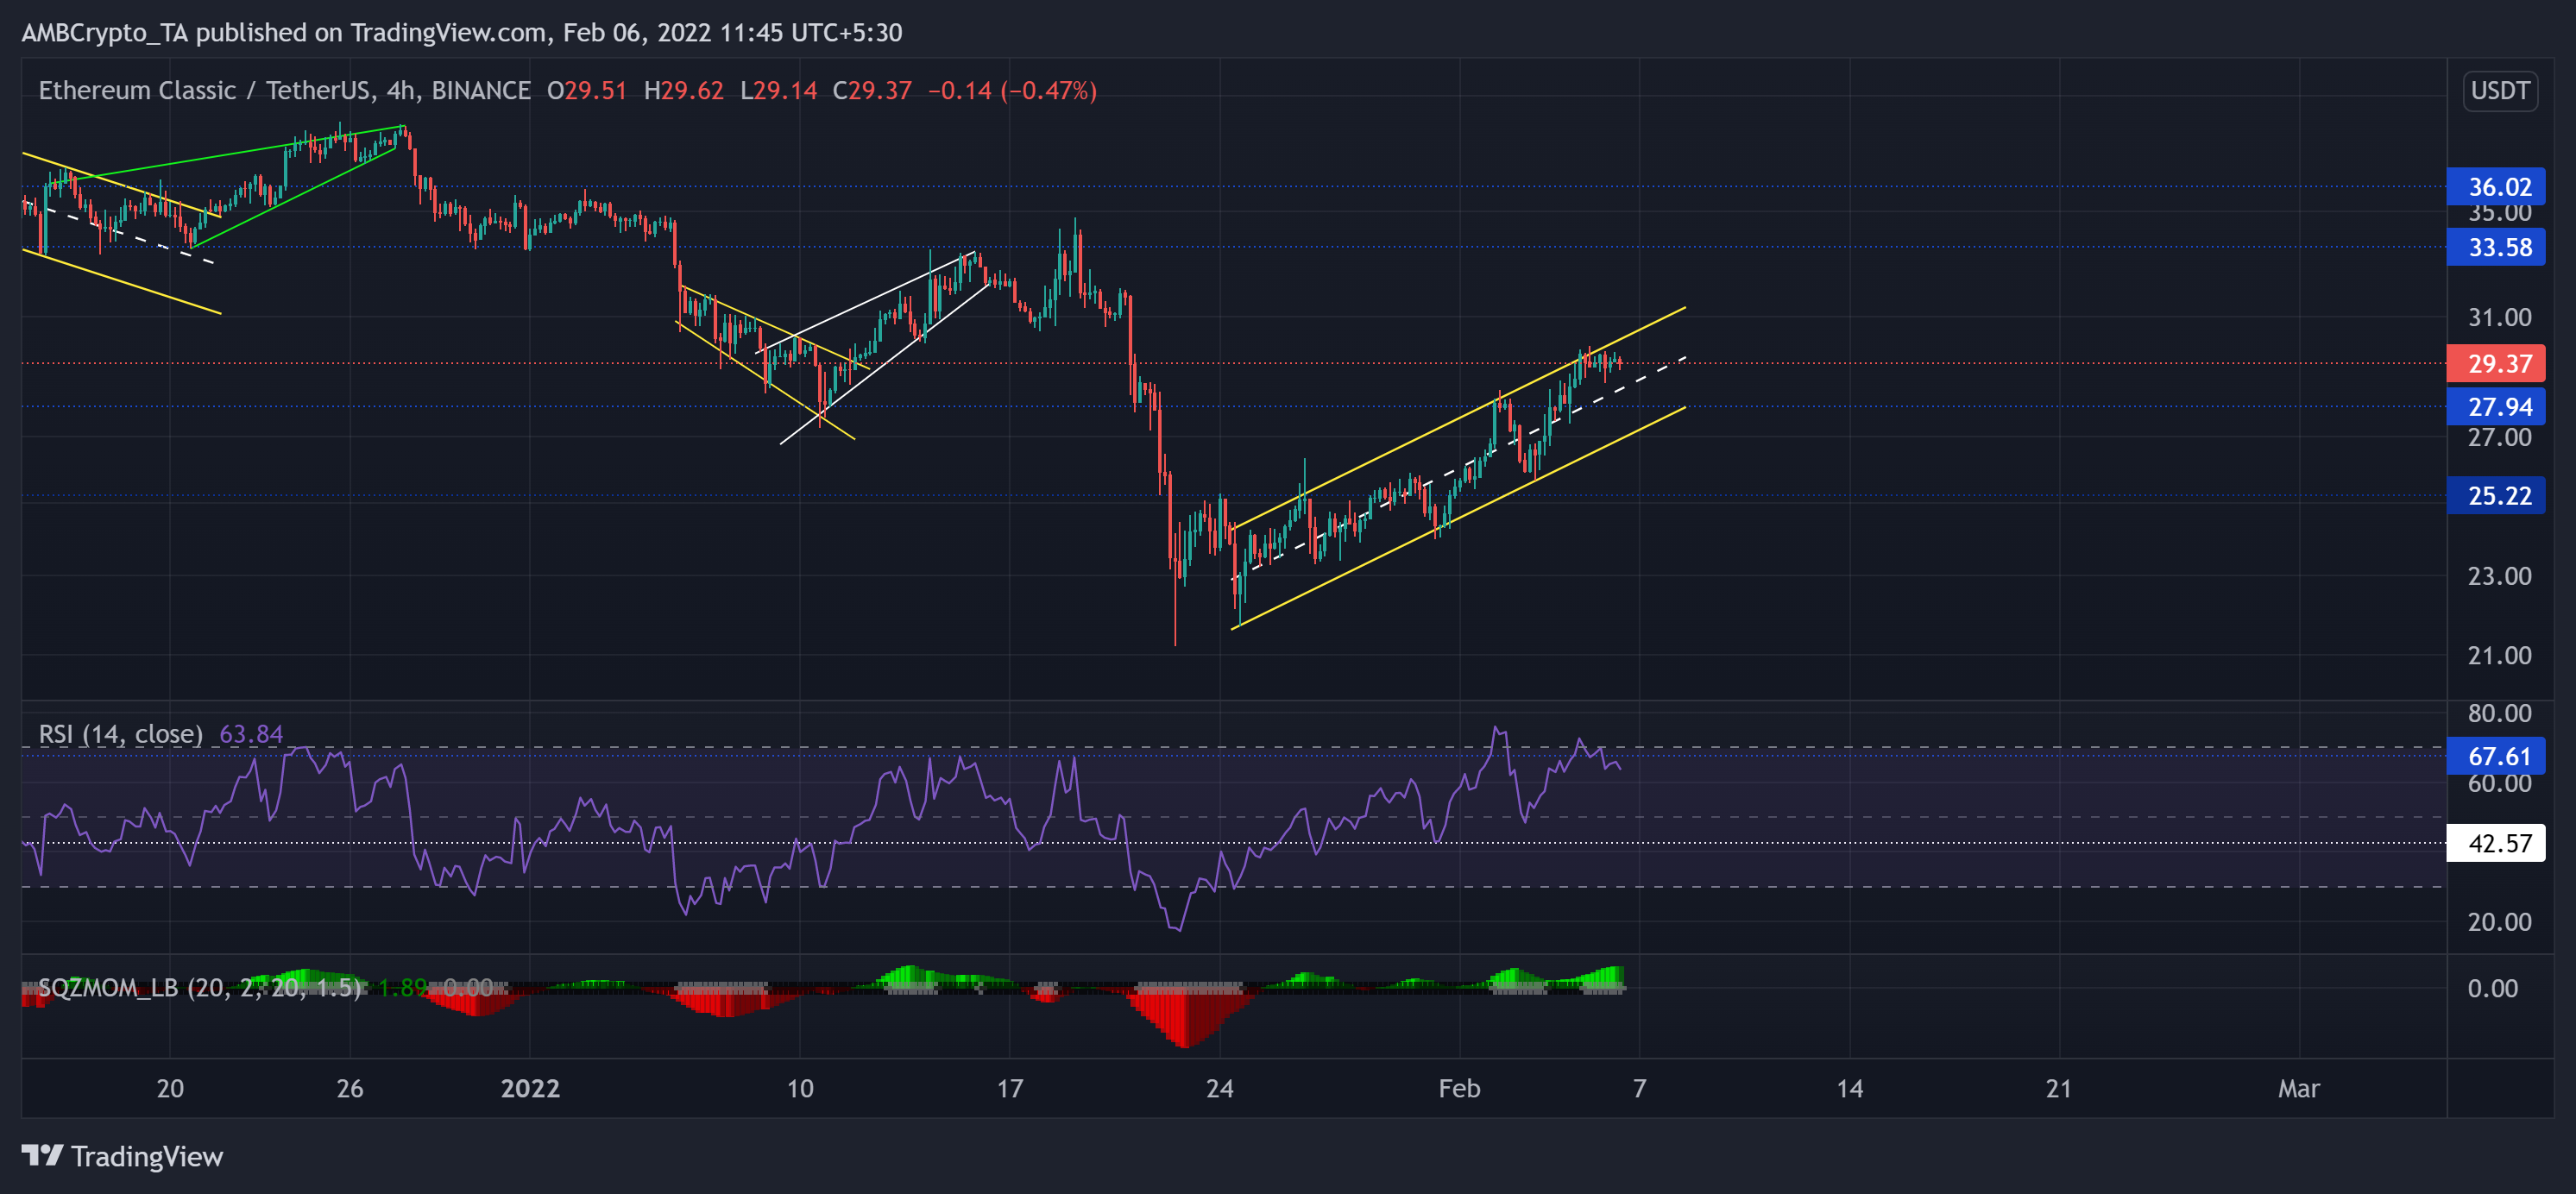
As the sell-off phase initiated, ETC lost 39.98% (from 19 January high) and touched its nine-month low on 22 January. However, since then, the altcoin has registered a staggering 41.63% ROI in the last two weeks.
The alt formed an up-channel (yellow) on its 4-hour chart over the last few days. Now, the testing point for the bulls continued to stand at the upper trendline of the up-channel.
At press time, ETC traded at $29.37. Over the past 24-hours, the RSI reversed from the overbought region and tested the 63-mark support. Further, the Squeeze Momentum Indicator flashed grey dots, iterating a high volatility phase. If the buyers start to lose their grip, the sellers could initiate a test of the $27.9-level.


