
The prominence of the Solana platform was highlighted once again recently when Coinbase decided to list Solana-based tokens, Bonfida and Orca. A bullish outlook for the Solana platform may be perking up as even the Bank of America noted Solana’s priority toward scalability which could help its growth as a settlement layer. On the charts, Solana’s native token SOL has labored in a downtrend in the past two months. Could some relief be seen in the coming days, and can SOL break the downtrend?
SOL- 12H

Source: SOL/USDT on TradingView
The downtrend was started in early December when SOL breached its previous lows, and over the course of the month, SOL was unable to climb past the $204 level, confirming a downtrend. In the past two weeks, SOL has seen a decent bounce from the $83.6 lows.
Hence, we have a longer-term downtrend within which a short-term uptrend was playing out. The new lower high at $110.19 (wick to $113.66) marked an area that SOL has to climb above and retest as support to show evidence of strong bullishness (near-term).
If such a scenario unfolds, SOL could be expected to climb rather easily to $130 considering how low trading volume in the $110-$130 has been on the way down. But, between the $130-$150 area lies strong resistance.
Rationale
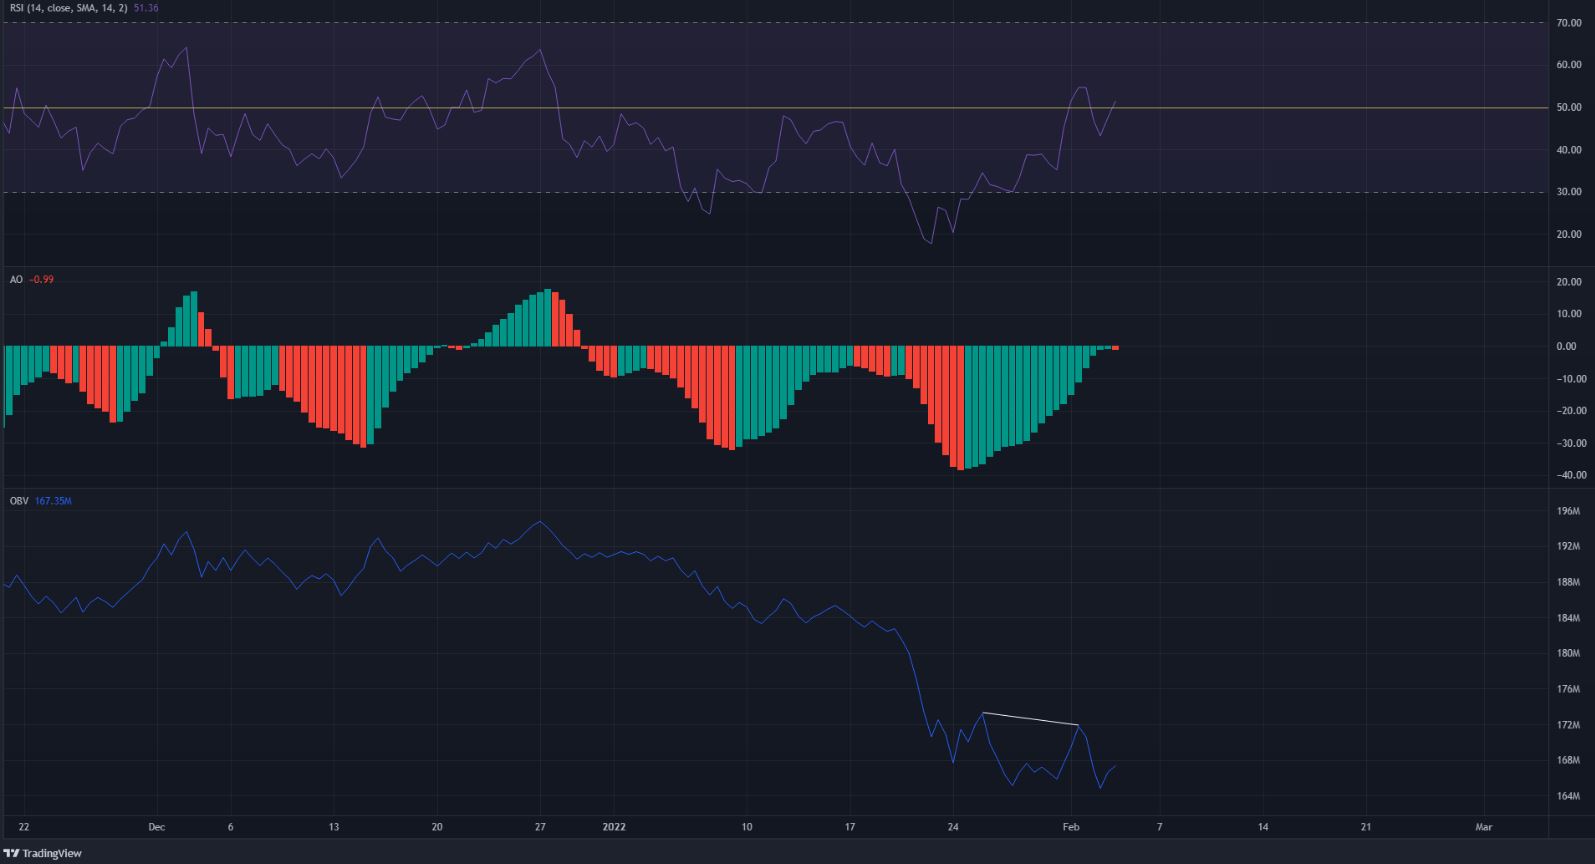
Source: SOL/USDT on TradingView
The VPVR, as already highlighted, showed that the $110-$130 area could be quickly traversed due to a lack of trading volume. However, it was not yet clear that the gains of the past week could be extended to push SOL that high.
The RSI climbed above neutral 50 while the Awesome Oscillator also appeared to be at the zero line, on the verge of crossing over to the upside. Yet, the OBV registered lower highs which showed that, even though demand was present, it might not be significant enough to outweigh the selling volume.
Conclusion
A move above $113 and a bullish retest of this level could see SOL climb to $130. In that area, the longer-term trend’s strength might begin to exert significant pressure downward on the prices. It could also offer enormous liquidity for the large market participants to tap into, before reversing the price lower. Therefore, $113 and $130 remain resistances to watch, while the $95 mark could offer short-term support.

![Why Chainlink [LINK] and Polygon [MATIC] are more similar than you realise](https://ambcrypto.com/wp-content/uploads/2024/04/Chainlink_and_Polygon-1-400x240.webp)