- SOL’s Futures Open Interest has dropped to its lowest level in two months.
- Key technical indicators suggest that the coin’s price decline may continue.
Solana’s [SOL] Futures Open Interest has cratered to a two-month low amid the general market downturn, according to Coinglass data.
Futures Open Interest refers to the total number of a coin’s Futures contracts that have yet to be settled or closed.
When it declines, it suggests that market participants are closing their positions without opening new ones.
Per Coinglass data, SOL’s Futures Open Interest climbed to a year-to-date (YTD) high of $3.41 billion, after which it initiated a decline. At $1.8 billion as of this writing, the coin’s Open Interest has since fallen by 47%.
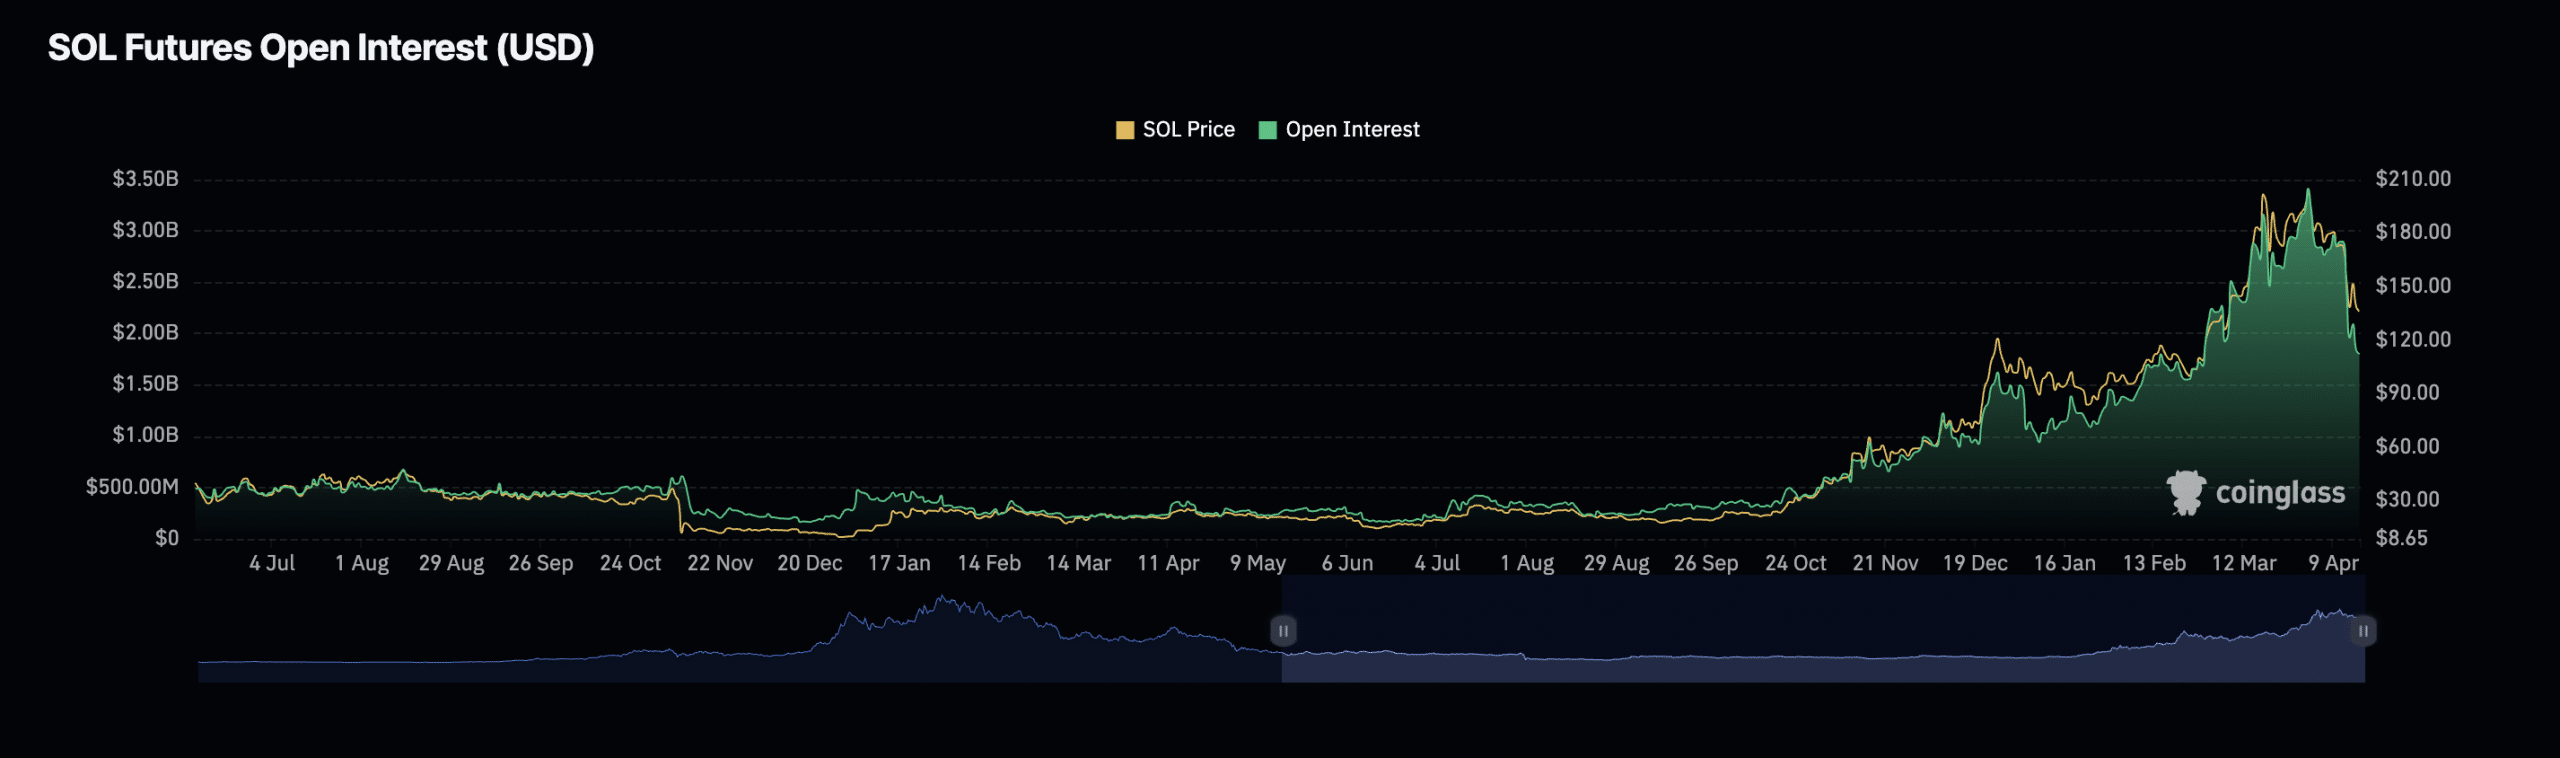
Source: Coinglass
Long traders have it rough
At press time, SOL exchanged hands at $140.44. In the last week, the altcoin’s value has declined by 19%, according to CoinMarketCap.
This price drop mirrors the decline that has plagued the general crypto market in the past few weeks.
CoinGecko’s data showed that the global cryptocurrency market capitalization has dropped by 8% in the past 14 days.
Due to the decline in SOL’s price, there has been an unprecedented uptick in long liquidations in the coin’s futures market.
Liquidations happen in an asset’s derivatives market when a trader’s position is forcefully closed due to insufficient funds to maintain it.
Long liquidations occur when the value of an asset suddenly drops, and traders who have open positions in favor of a price rally are forced to exit their positions.
According to Coinglass, on the 12th of April, SOL’s long liquidations totaled $41.49 million, marking its YTD high.
Possibility of a rebound in the short term?
SOL’s key technical indicators, observed on a daily chart, suggested the possibility of a further decline in its value.
For example, its Elder-Ray Index returned a negative value as of this writing. This indicator measures the relationship between the strength of buyers and sellers in the market.
When its value is negative, it means that bear power is dominant in the market.
At the time of press, SOL’s Elder-Ray Index was -35.17. Since the beginning of the month, it has returned only negative values.
Likewise, its Aroon Down Line (blue) was 71.43%, while its Aroon Up Line (orange) was spotted at 0%.
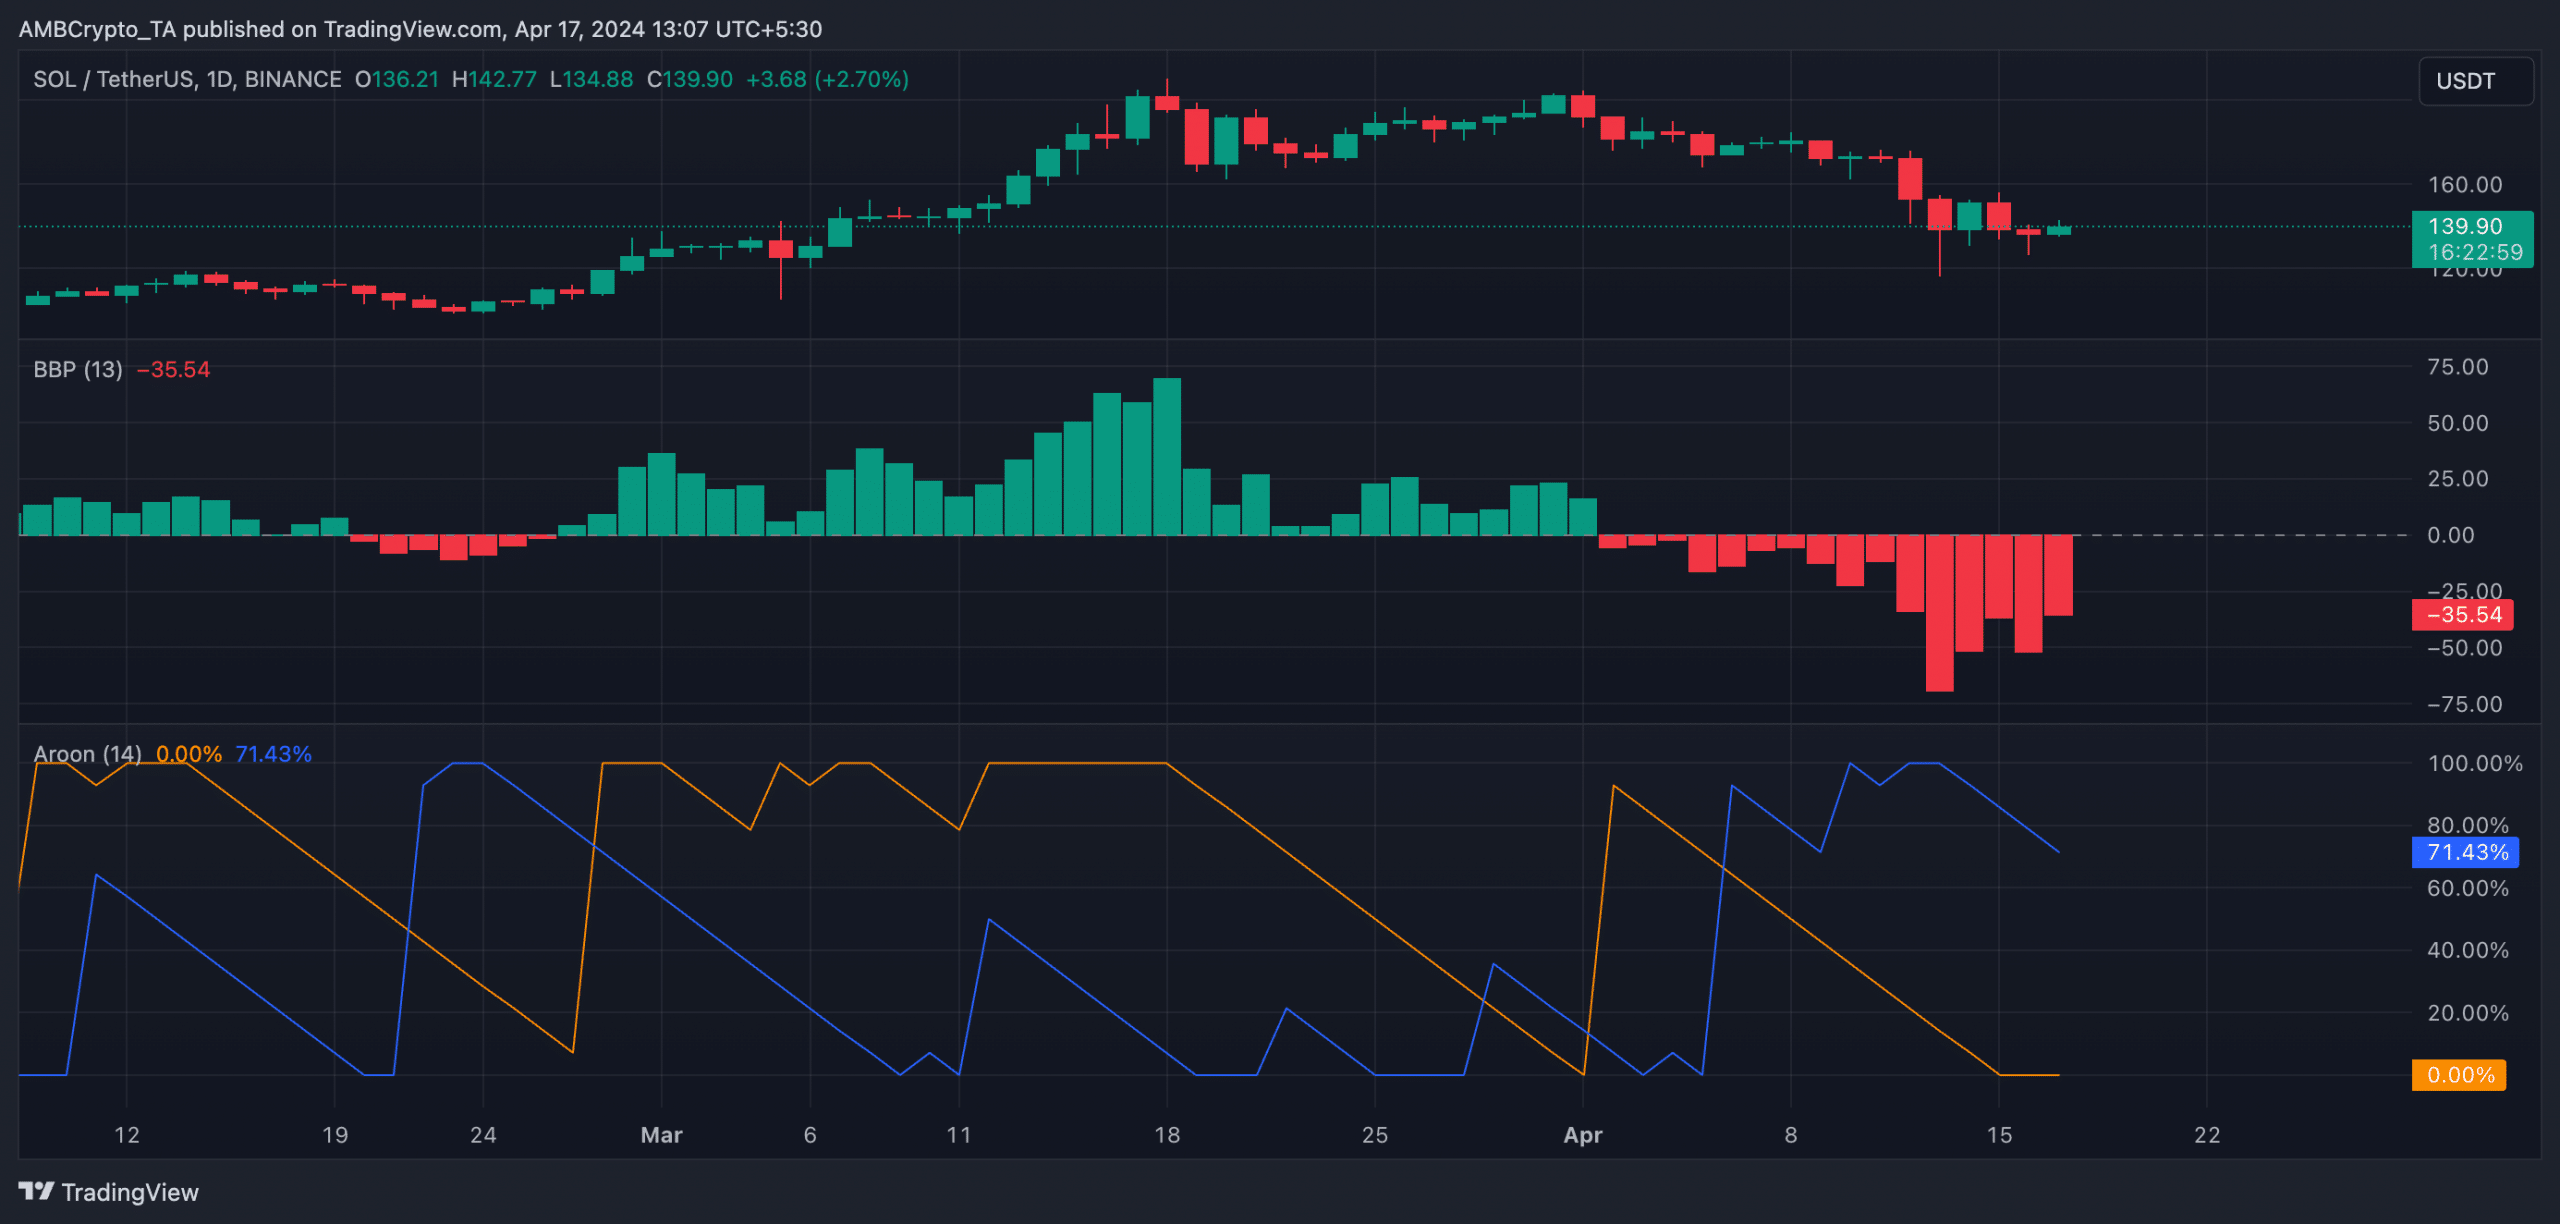
Source: SOL/USDT on TradingView
An asset’s Aroon indicator measures its trend strength and potential reversal points.
Read Solana’s [SOL] Price Prediction 2024-25
When the Down Line is close to 100, it indicates that the downtrend is strong and that the most recent low was reached relatively recently.
Conversely, when the Up Line is close to zero, the uptrend is weak, and the most recent high was reached long ago.