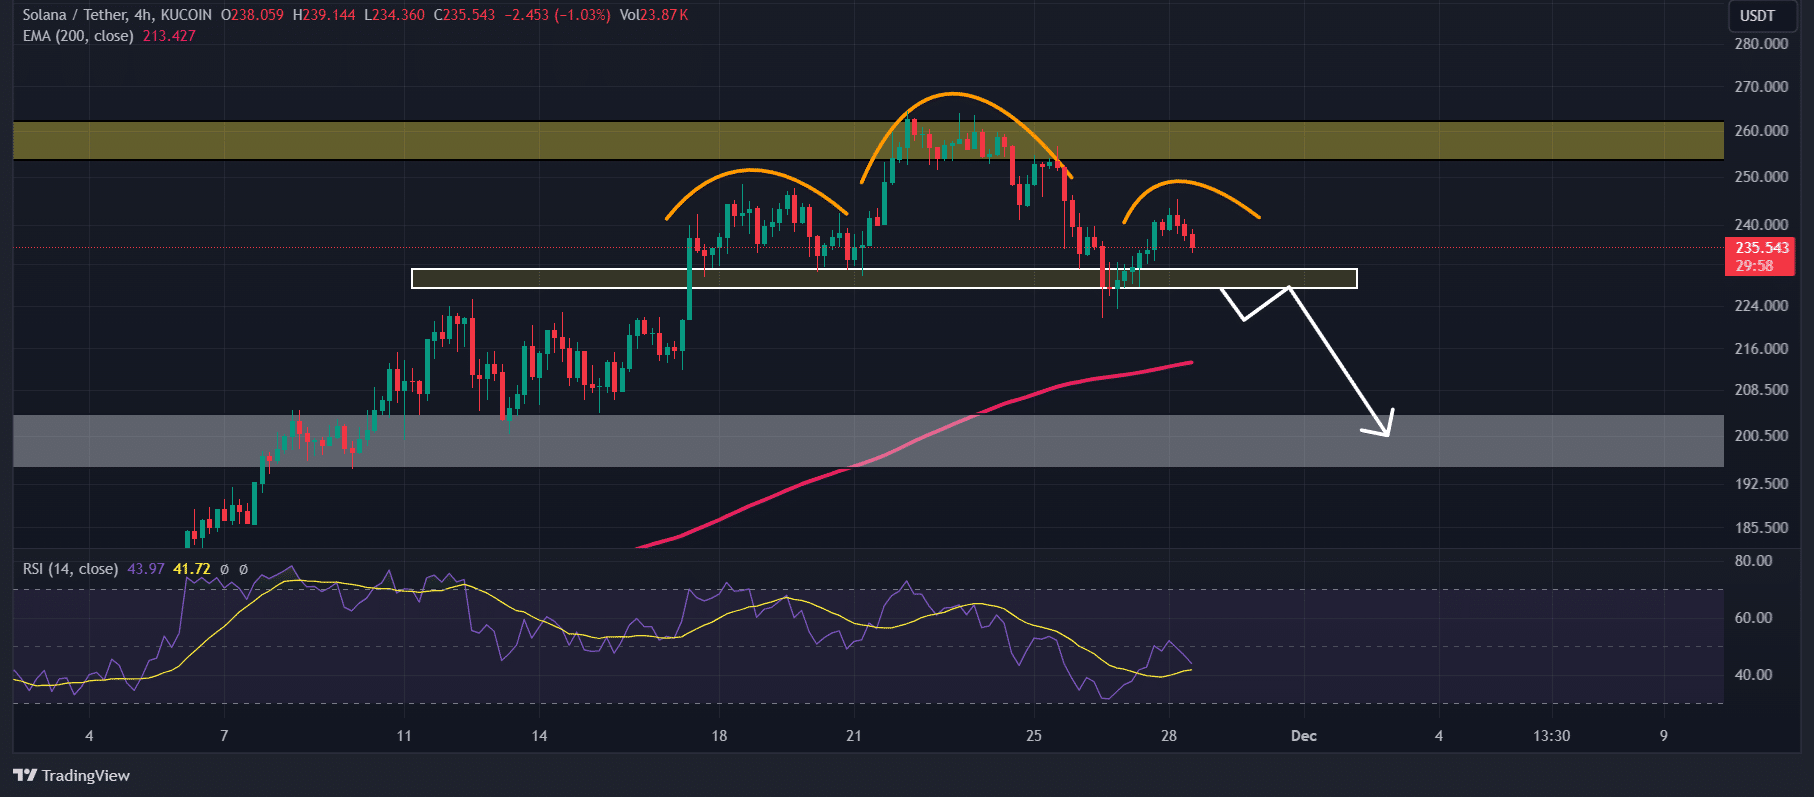
Solana: Will SOL drop to $200 after THIS bearish pattern emerges?

- Solana could decline by 12% to reach the $200 level if it breaches the neckline at the $230 level.
- SOL’s Spot Inflow/Outflow data indicated that whales are dumping their holdings from wallets to exchanges.
Solana [SOL], the world’s fourth-largest cryptocurrency, is poised for a price decline in the coming days.
During a recent price correction, SOL formed a bearish price pattern on a smaller time frame and appears set for a breakdown.
Solana’s bearish price patterns
According to AMBCrypto’s technical analysis, SOL appears to be forming a bearish head-and-shoulders pattern in a four-hour time frame. However, the pattern is not yet complete. So far, the SOL chart has successfully created one head and one shoulder, while the second shoulder is still missing.
Considering traders’ and investors’ participation along with the market structure, there is a strong possibility that this pattern could be completed in the coming hours.
Key technical levels to watch
If SOL completes this bearish pattern and breaches the neckline at the $230 level, it could decline by 12% to reach $200 in the coming days.
On the positive side, SOL’s Relative Strength Index (RSI) suggested a potential upside rally. SOL’s RSI stood at 45, near the oversold territory, indicating that SOL still has room to rise.
Bearish on-chain metrics
In addition to the technical analysis, on-chain metrics further support this bearish outlook. According to the on-chain analytics firm Coinglass, traders’ and investors’ interest in SOL appears to be lagging.
Coinglass reported that SOL’s Open Interest (OI) has declined by 5.4% in the past 24 hours, indicating that traders’ positions have been liquidated or that they may be hesitant to build new positions.
Besides low participation from traders, SOL’s Spot Inflow/Outflow data indicated a moderate inflow to exchanges. This suggests that whales or investors are depositing their holdings from wallets to exchanges, a move that typically creates selling pressure and can lead to a price decline.
Read Solana’s [SOL] Price Prediction 2024–2025
At press time, SOL was trading near $235 and has remained stable, experiencing a slight 0.10% decline in the last 24 hours.
During the same period, its trading volume dropped by 17%, indicating reduced participation from traders and investors amid a bearish outlook.


