Solana’s breakout odds – Did Circle’s USDC minting spree make an impact?
Solana is facing key levels as USDC minting fueled market speculation on the charts.

- Recent USDC minting on Solana has raised questions about its impact on the market
- Altcoin’s metrics, however, suggested potential volatility in the short-term
Solana’s (SOL) prices have been oscillating around critical levels lately, with its recent movements attracting significant interest. Its price action isn’t the only reason SOL is in the news today though.
In fact, according to a recent tweet from Lookonchain on X,
“Circle minted 250M $USDC on #Solana again 5 hours ago! #Circle has minted a total of 4.5B $USDC on #Solana since Apr 2.”
In response to Circle minting an additional 250 million USDC on Solana, the market has been left wondering how this large influx of liquidity may affect the price of SOL.
As of 2 April, Circle had minted a record-breaking 4.5 billion USDC on Solana, making it a turning point for traders as well as investors.The latest minting activity, however, could have even bigger consequences for the altcoin.
What does USDC minting mean for Solana?
Well, it is difficult to determine whether or not an increase in USDC supply would affect the liquidity position of Solana. If there are more funds in circulation, then trading could be more intense and either boost SOL or cause its decline.
The key question will be – How is this flux digested by the market and will it stimulate demand or initiates sell-offs?
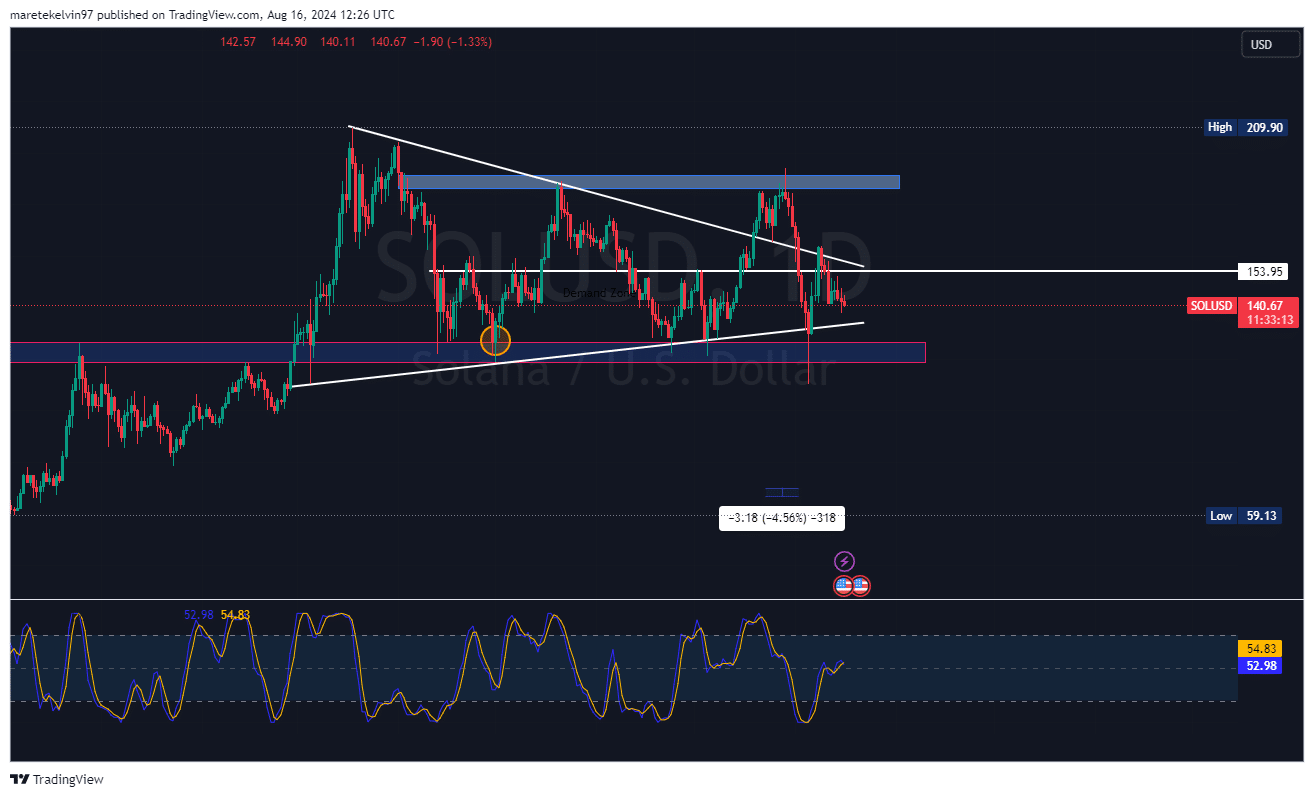
Triangle squares up!
Taking a closer look, SOL’s price chart revealed that a symmetrical triangle pattern might just be taking shape. This is usual when volatility tends to happen soon.
At the time of writing, while the crypto was testing $140 as a key support level, it still faced resistance at $153.95. A breakout in either direction may set up more significant moves for Solana, thus making this an important period for any investor.
A warning sign for Solana?
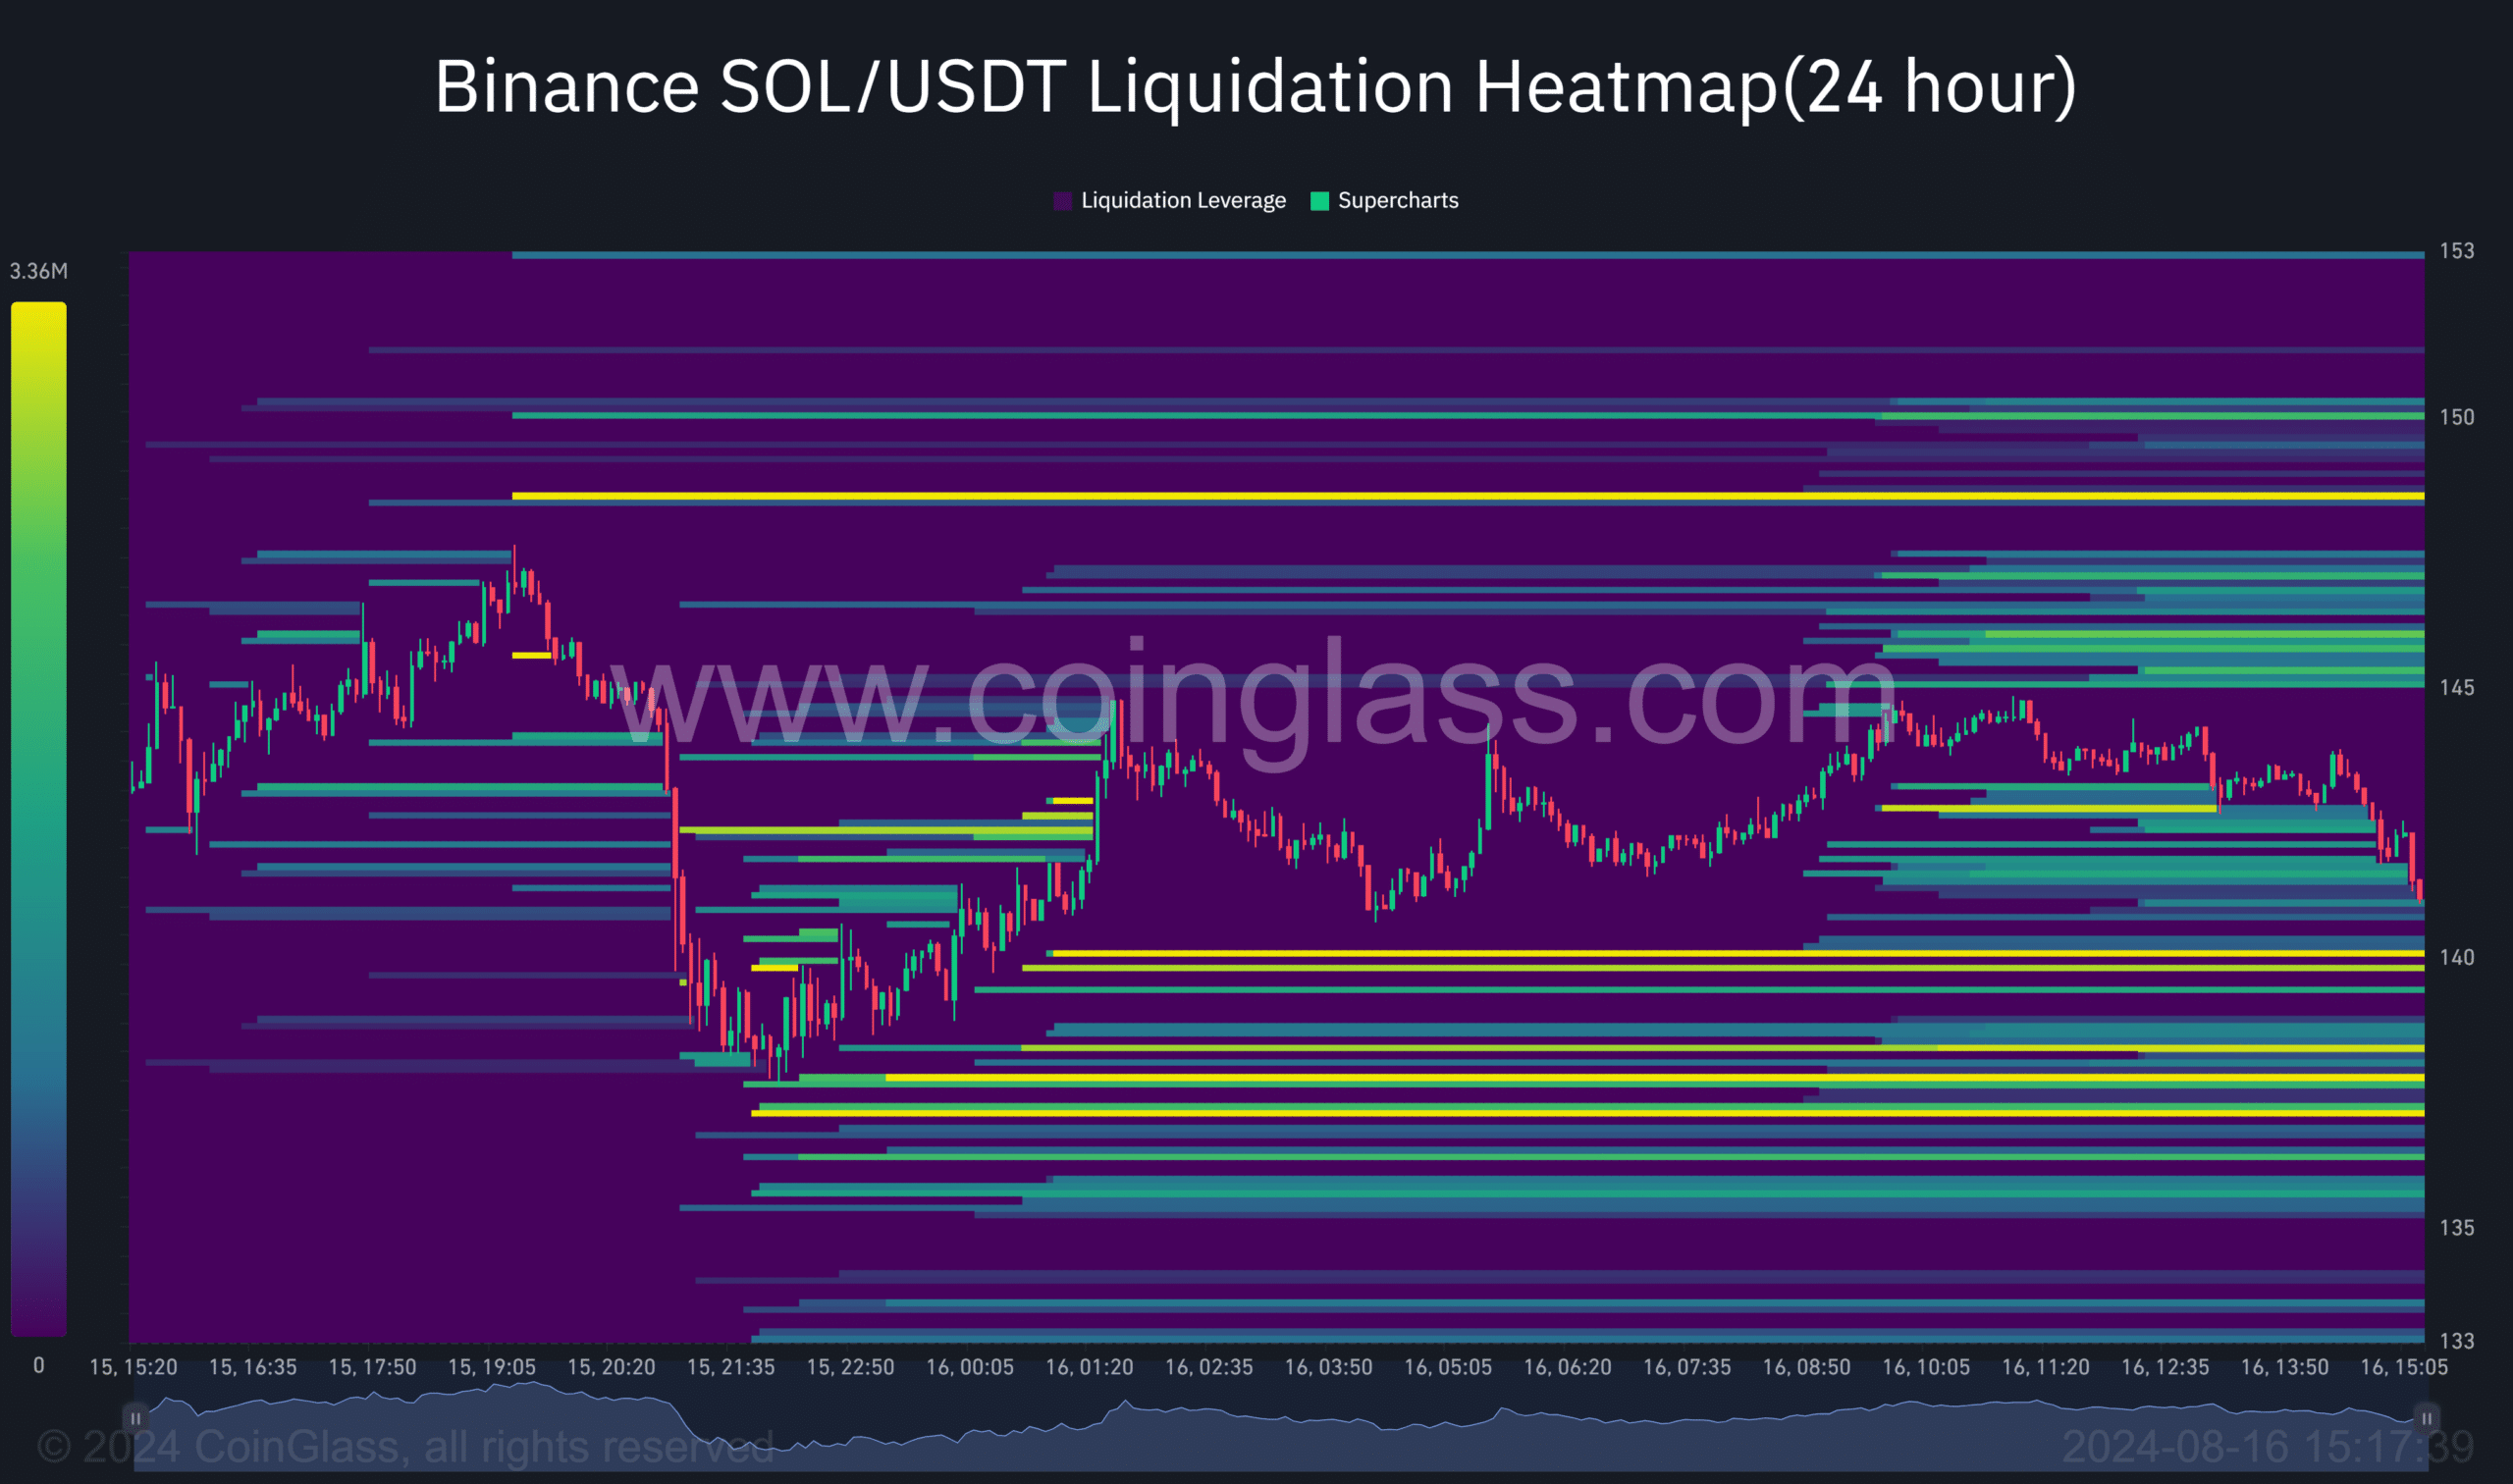
Liquidation heatmap data from Coinglass spoke volumes about the altcoin’s market sentiment.
At the $140-145 range, the heatmap revealed higher liquidation activity. If Solana falls through these levels, we could see a lot of forced liquidations, which will result in sharp changes in price.
What is happening behind the scenes?
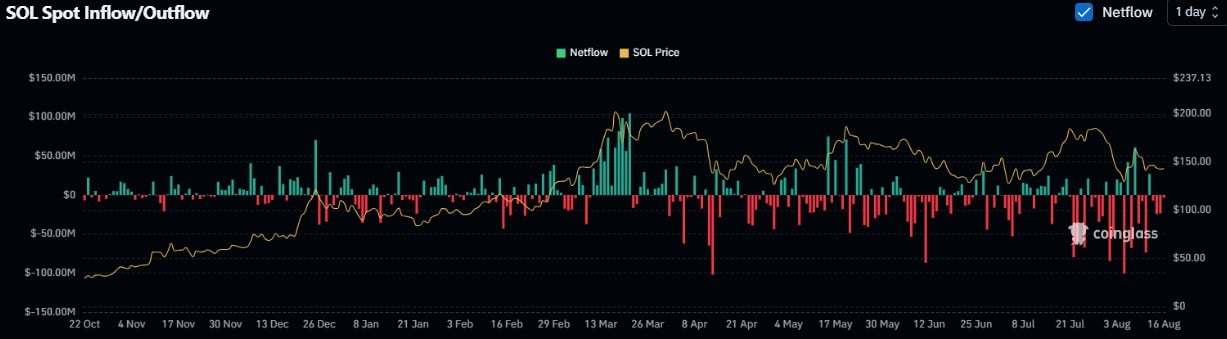
The data on Netflows from Coinglass is also quite telling.
For an extended period, Solana has seen consistent negative outflows, with more SOL going out of exchanges than being added. This is usually indicative of asset holding by investors who anticipate future profits.
SOL support levels are critical as the market waits on the edge. Recent USDC minting, coupled with key market indicators, suggested that volatility may be imminent.
However, the next few hours on the charts will actually determine Solana’s short-term direction.