Solana’s bulls push higher, but is the price rally running too hot?
Solana is bullish, very bullish, but how high can it really go?



Like the rest of the market, Solana’s price rally showed little signs of slowing down after SOL hiked by over 5% in 24 hours to trade at $106.71 at press time.
The latest push on the charts came on the back of a key governance vote, one that could reduce future SOL supply. Sustained Spot ETF inflows have also been helping the altcoin’s price action.
Weekly trend leaves room for further upside
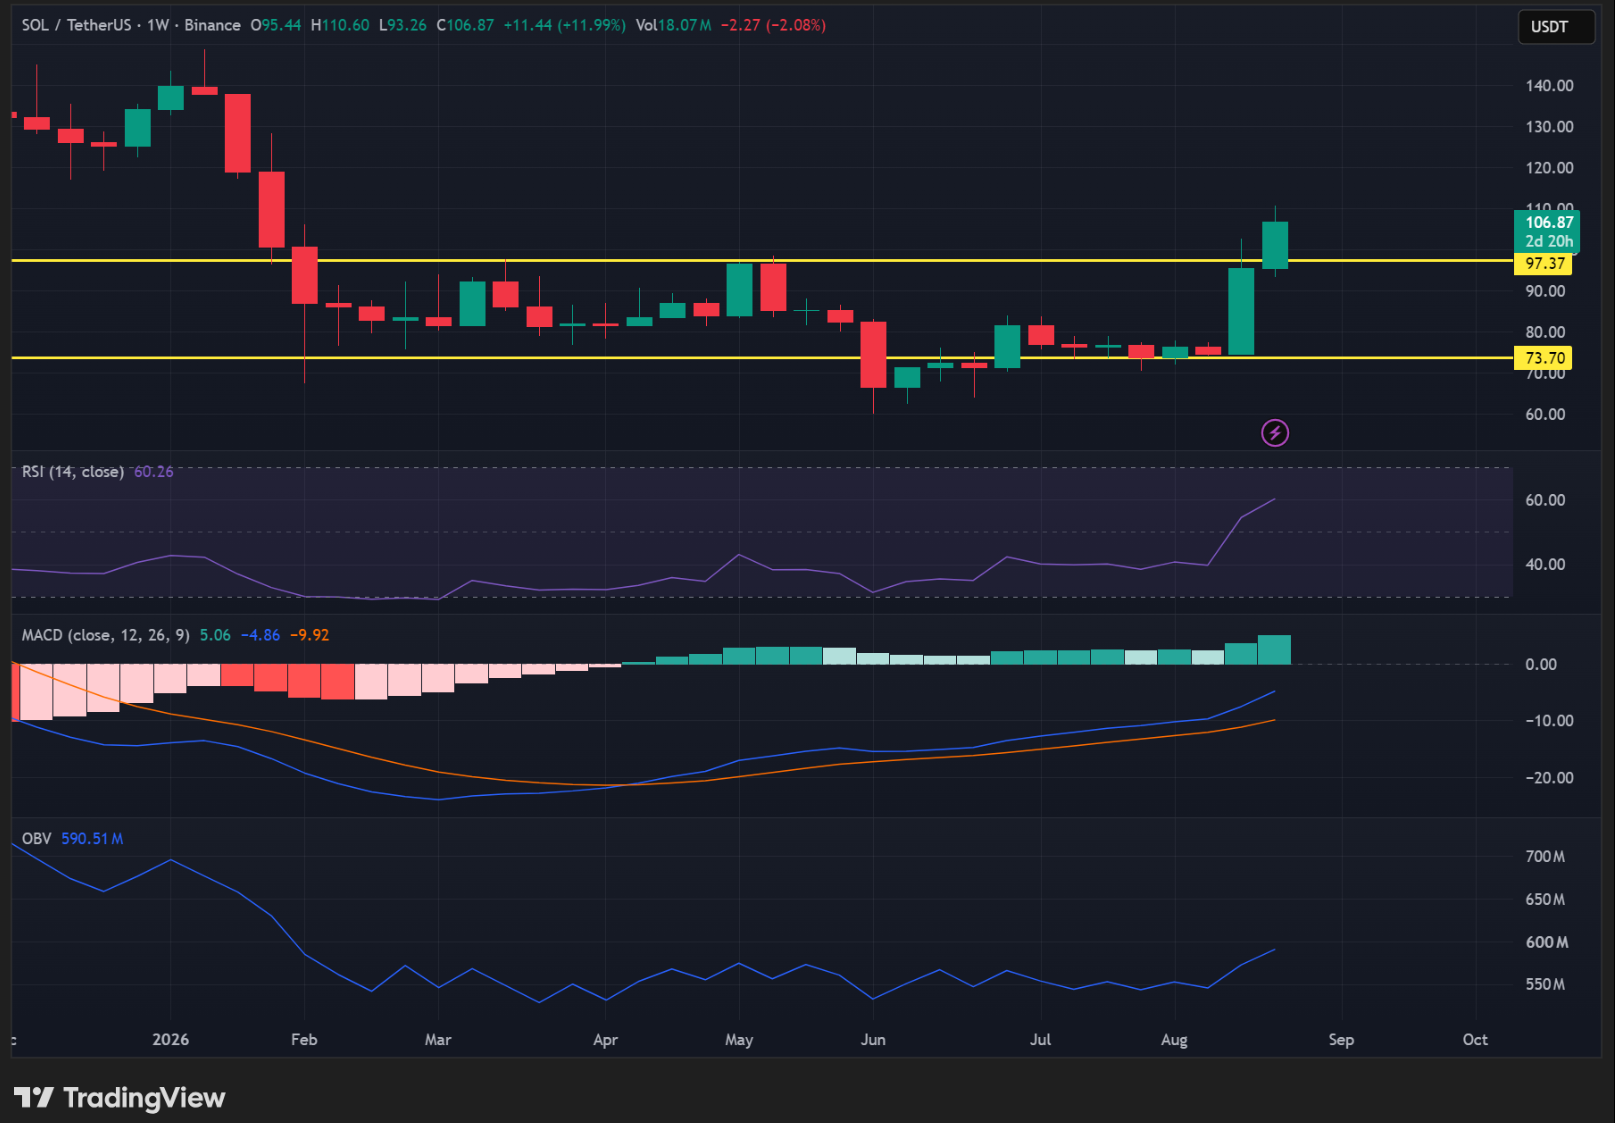
On the weekly chart, SOL has been bullish after consolidating within the $67–$100 range. With an RSI of 60.37 at the time of writing, momentum appeared to be strong, with buyers clearly having the advantage without being pushed too far into the overbought zone.
The MACD was above its Signal line but below zero, suggesting that the broader bullish trend was yet to be confirmed.
The OBV has been trending flat too, but its recent uptick may be a positive sign. Especially since sustained buying pressure is needed to maintain the weekly uptrend.
Daily momentum remains firmly bullish
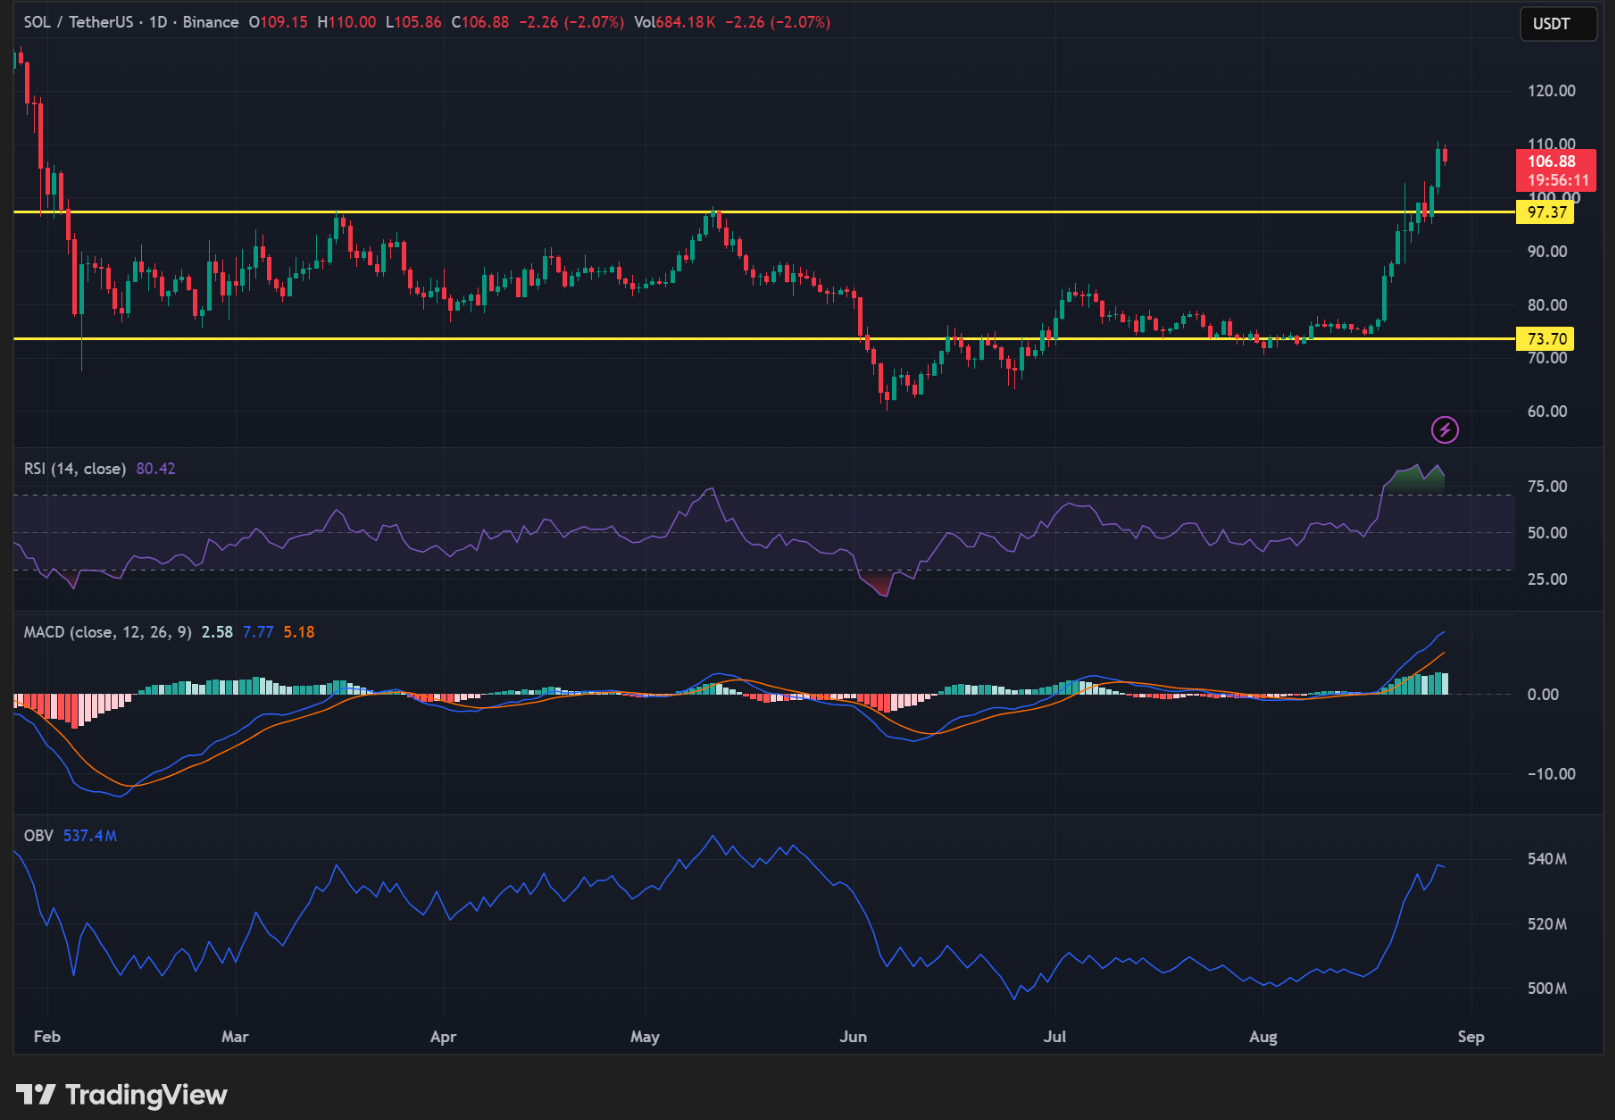
SOL broke above the key $97.37 resistance level on 24th August 2026, a level it hasn’t been able to breach since early February 2026. At press time, the bulls were attempting to defend it as support.
The RSI at 81.31 put the daily chart firmly in overbought territory. However, as seen on the weekly chart, the broader trend still has room to grow, suggesting the daily overbought conditions and rally can persist. MACD remained above its Signal and zero lines, reinforcing the bullish trend, while a slight OBV downturn could signal some near-term cooling.
Bulls retain control in the short-term
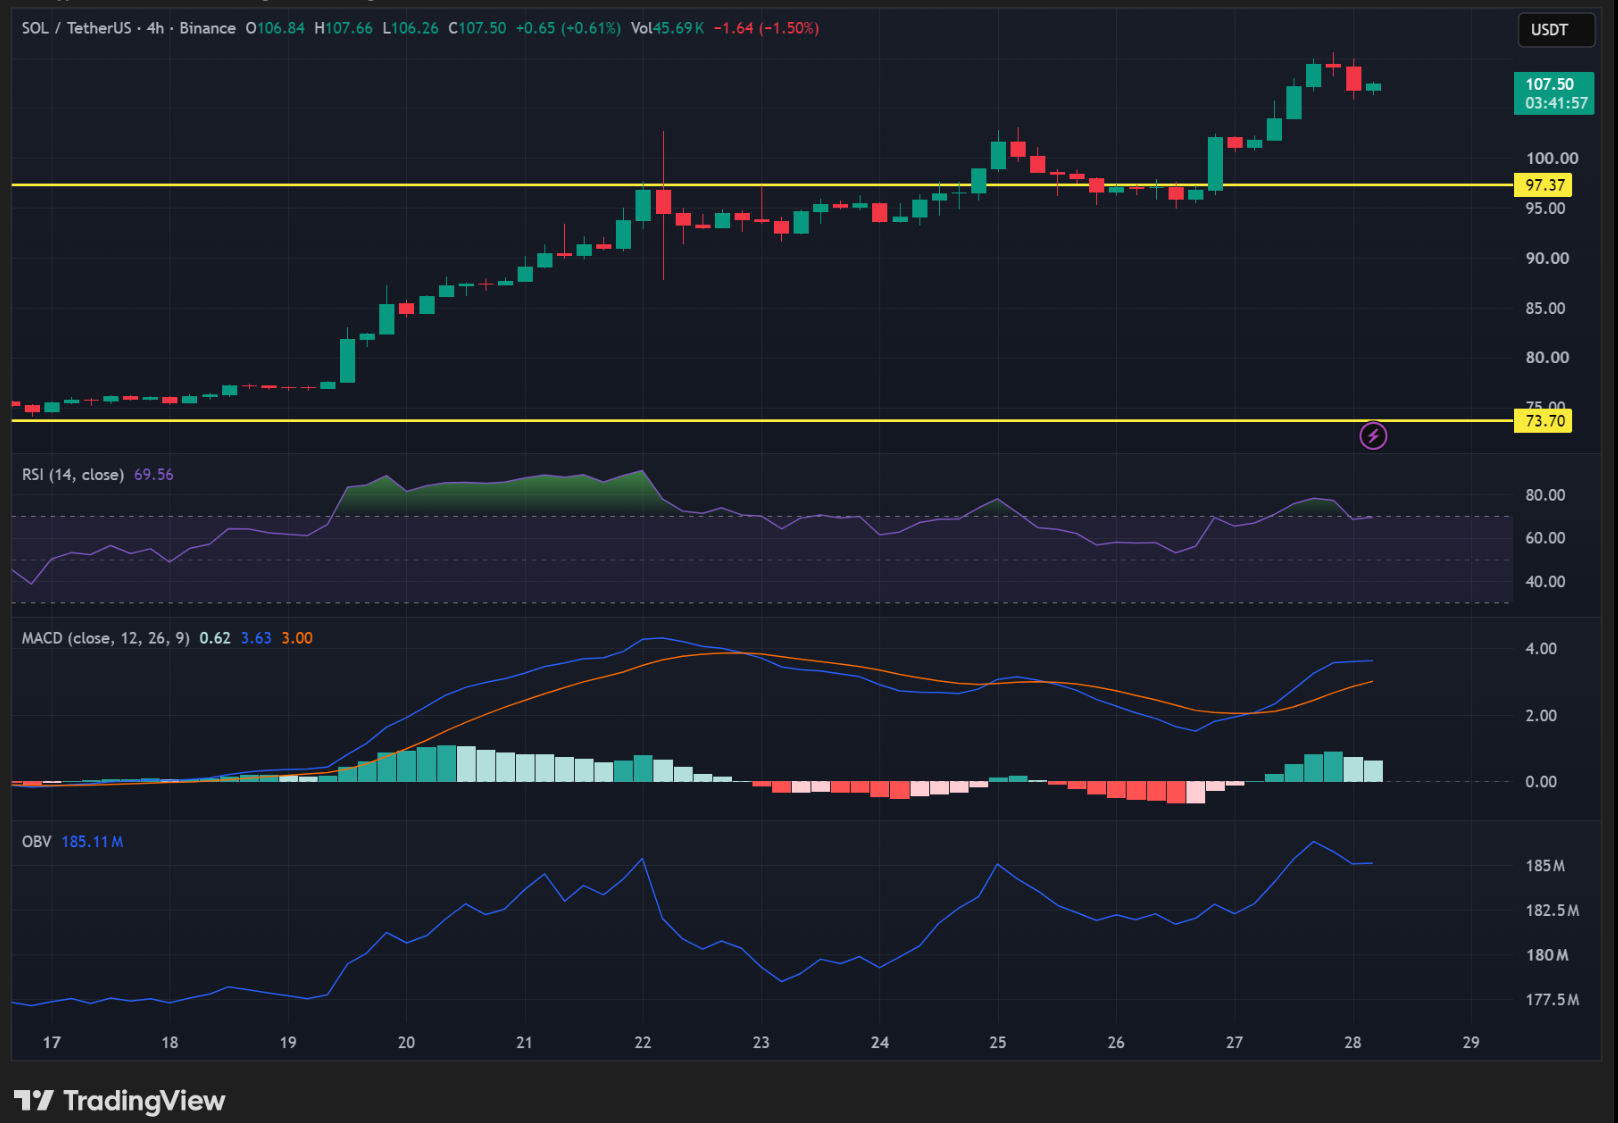
The 4-hour chart also supported the altcoin’s ongoing bullish rally. The RSI came out of the overbought zone and had a reading of 68.08, indicating that buyers still have the advantage.
The MACD was firmly bullish above both its Signal and zero lines, while the rising OBV further confirmed that buying pressure was supporting the move higher.
Final summary
- SOL’s 4-hour chart was firmly bullish, while a successful retest of the $102-level as support could open the door for buyers wanting to enter the market.
- While SOL was firmly overbought on the daily chart, the weekly timeframe leaves room for the broader bullish trend to continue.