
- Solana consolidated for 170 days as the 8-hour timeframe charts suggested bullishness
- History to repeat itself as SOL Futures’ Open Interest rose by 1.42%
Jito, Solana’s top staking protocol by total value locked (TVL), surpassed 12 million SOL in locked value, driven by MEV staking rewards and rising LST adoption.
Meanwhile, Jupiter Exchange, another Solana swap aggregator, became the leading derivatives protocol by TVL across all chains with $698 million worth of SOL. This, ahead of GMX, Hyperliquid Perp, DYDX and Drift, respectively.
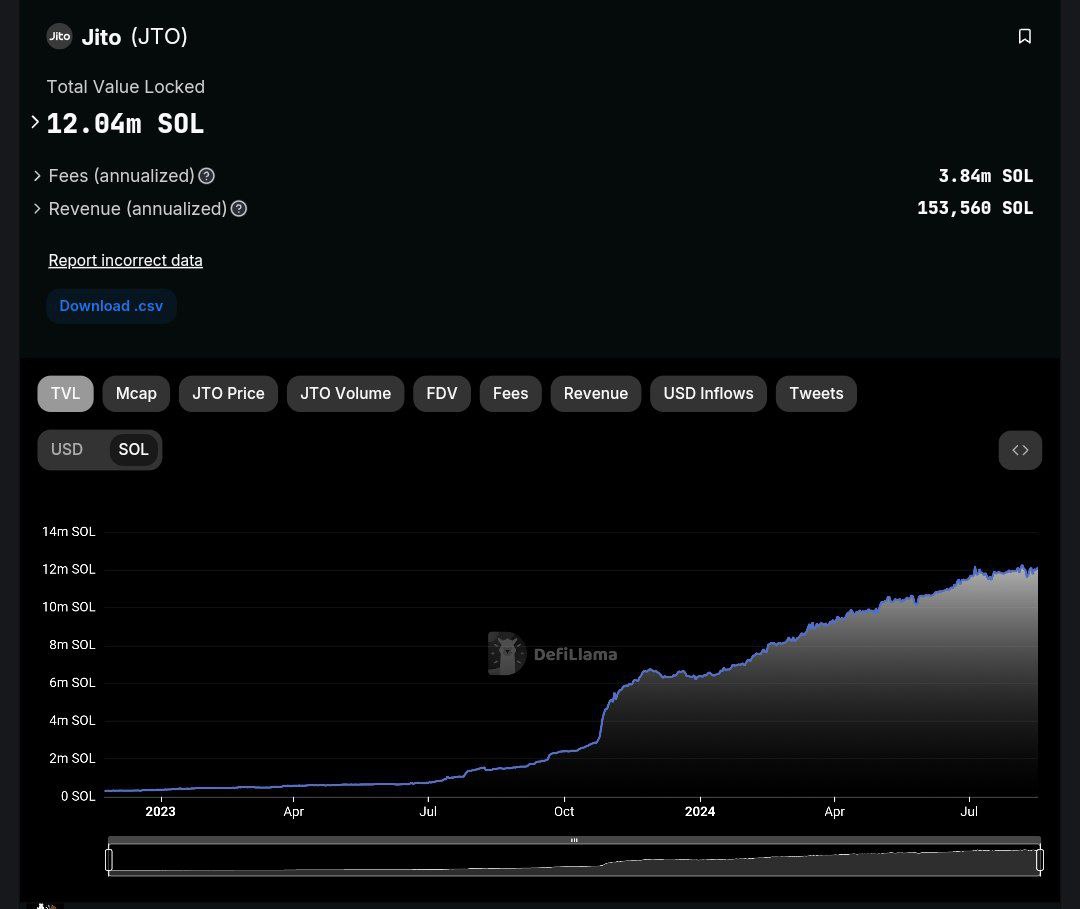
Source: DefiLlama
This surge in competition and rising TVL on Solana suggests increased blockchain activity – A sign of potential price growth for Solana-based assets.
Adding to its DeFi arena dominance, Solana also reclaimed the $137.5-price level, rebounding from last week’s mid-range.
Solana [SOL], for its part, has been consolidating around the price range of $120-$210 for about 170 days now, bouncing between monthly support and resistance levels. The expectation is that if the price breaks out of consolidation, there might be a significant move to the upside, potentially driving the price to $400-$500 and even $800-$1,000 in the long term.
In fact, the wedge pattern on SOL/USDT indicated institutional accumulation, offering a prime entry point for long-term investors.
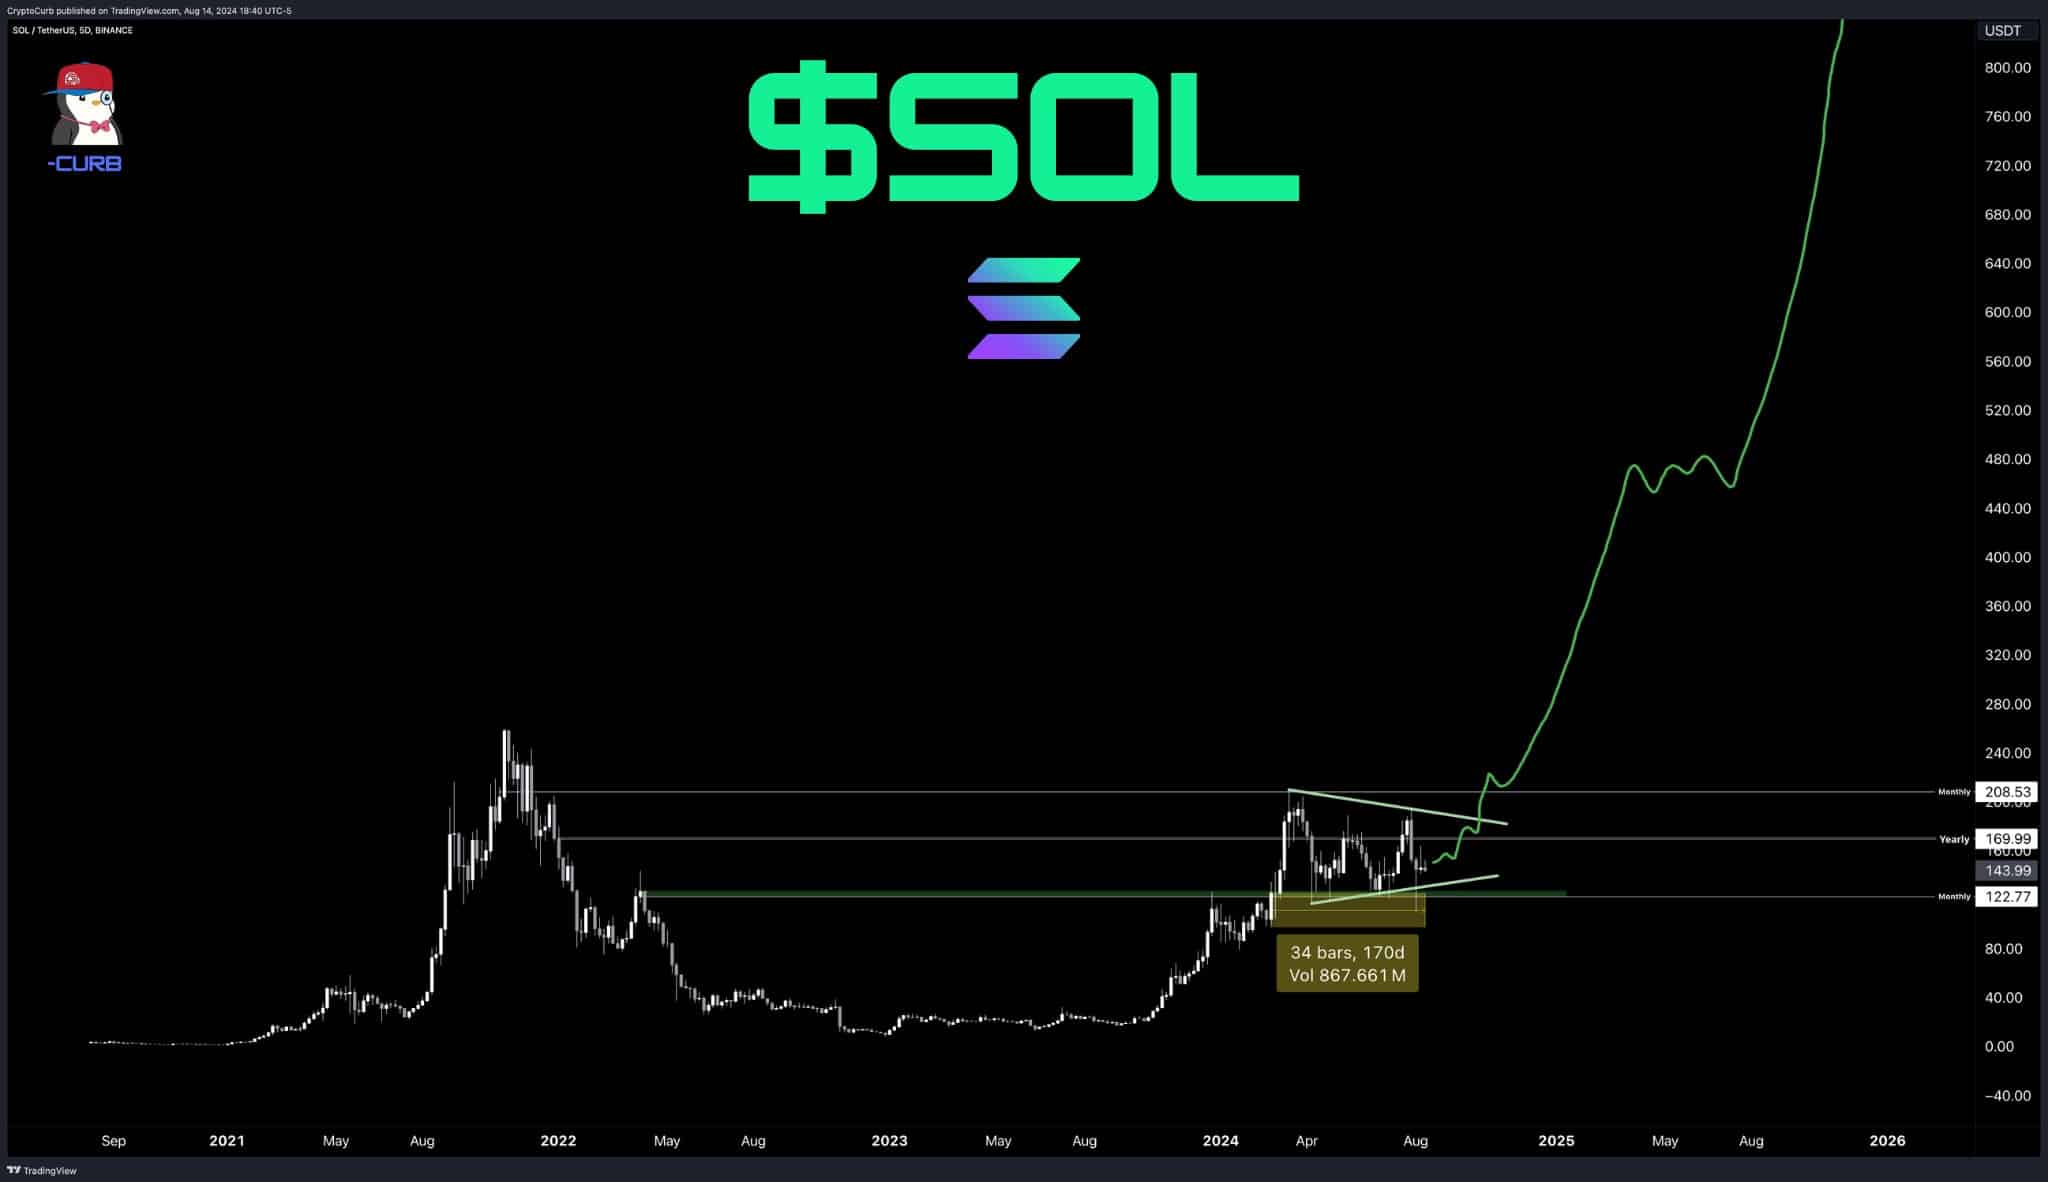
Source: Crypto Curb, TradingView
Solana 4H & 8H signal pennant pattern
Solana’s 4-hour and 8-hour timeframe charts seemed to be showing strong bullish signals, indicating a potential hike to the $204-level, aligning with the Bullish Pennant pattern.
While the 1-hour chart pointed to a retest of $118 with a reverse head and shoulders pattern, this can be considered noise compared to the stronger signals on the longer timeframes.
Hence, focus should remain on the 4-hour and 8-hour charts, which are in sync for higher price targets. Especially as Solana may be set to continue with its upward trend on the charts.
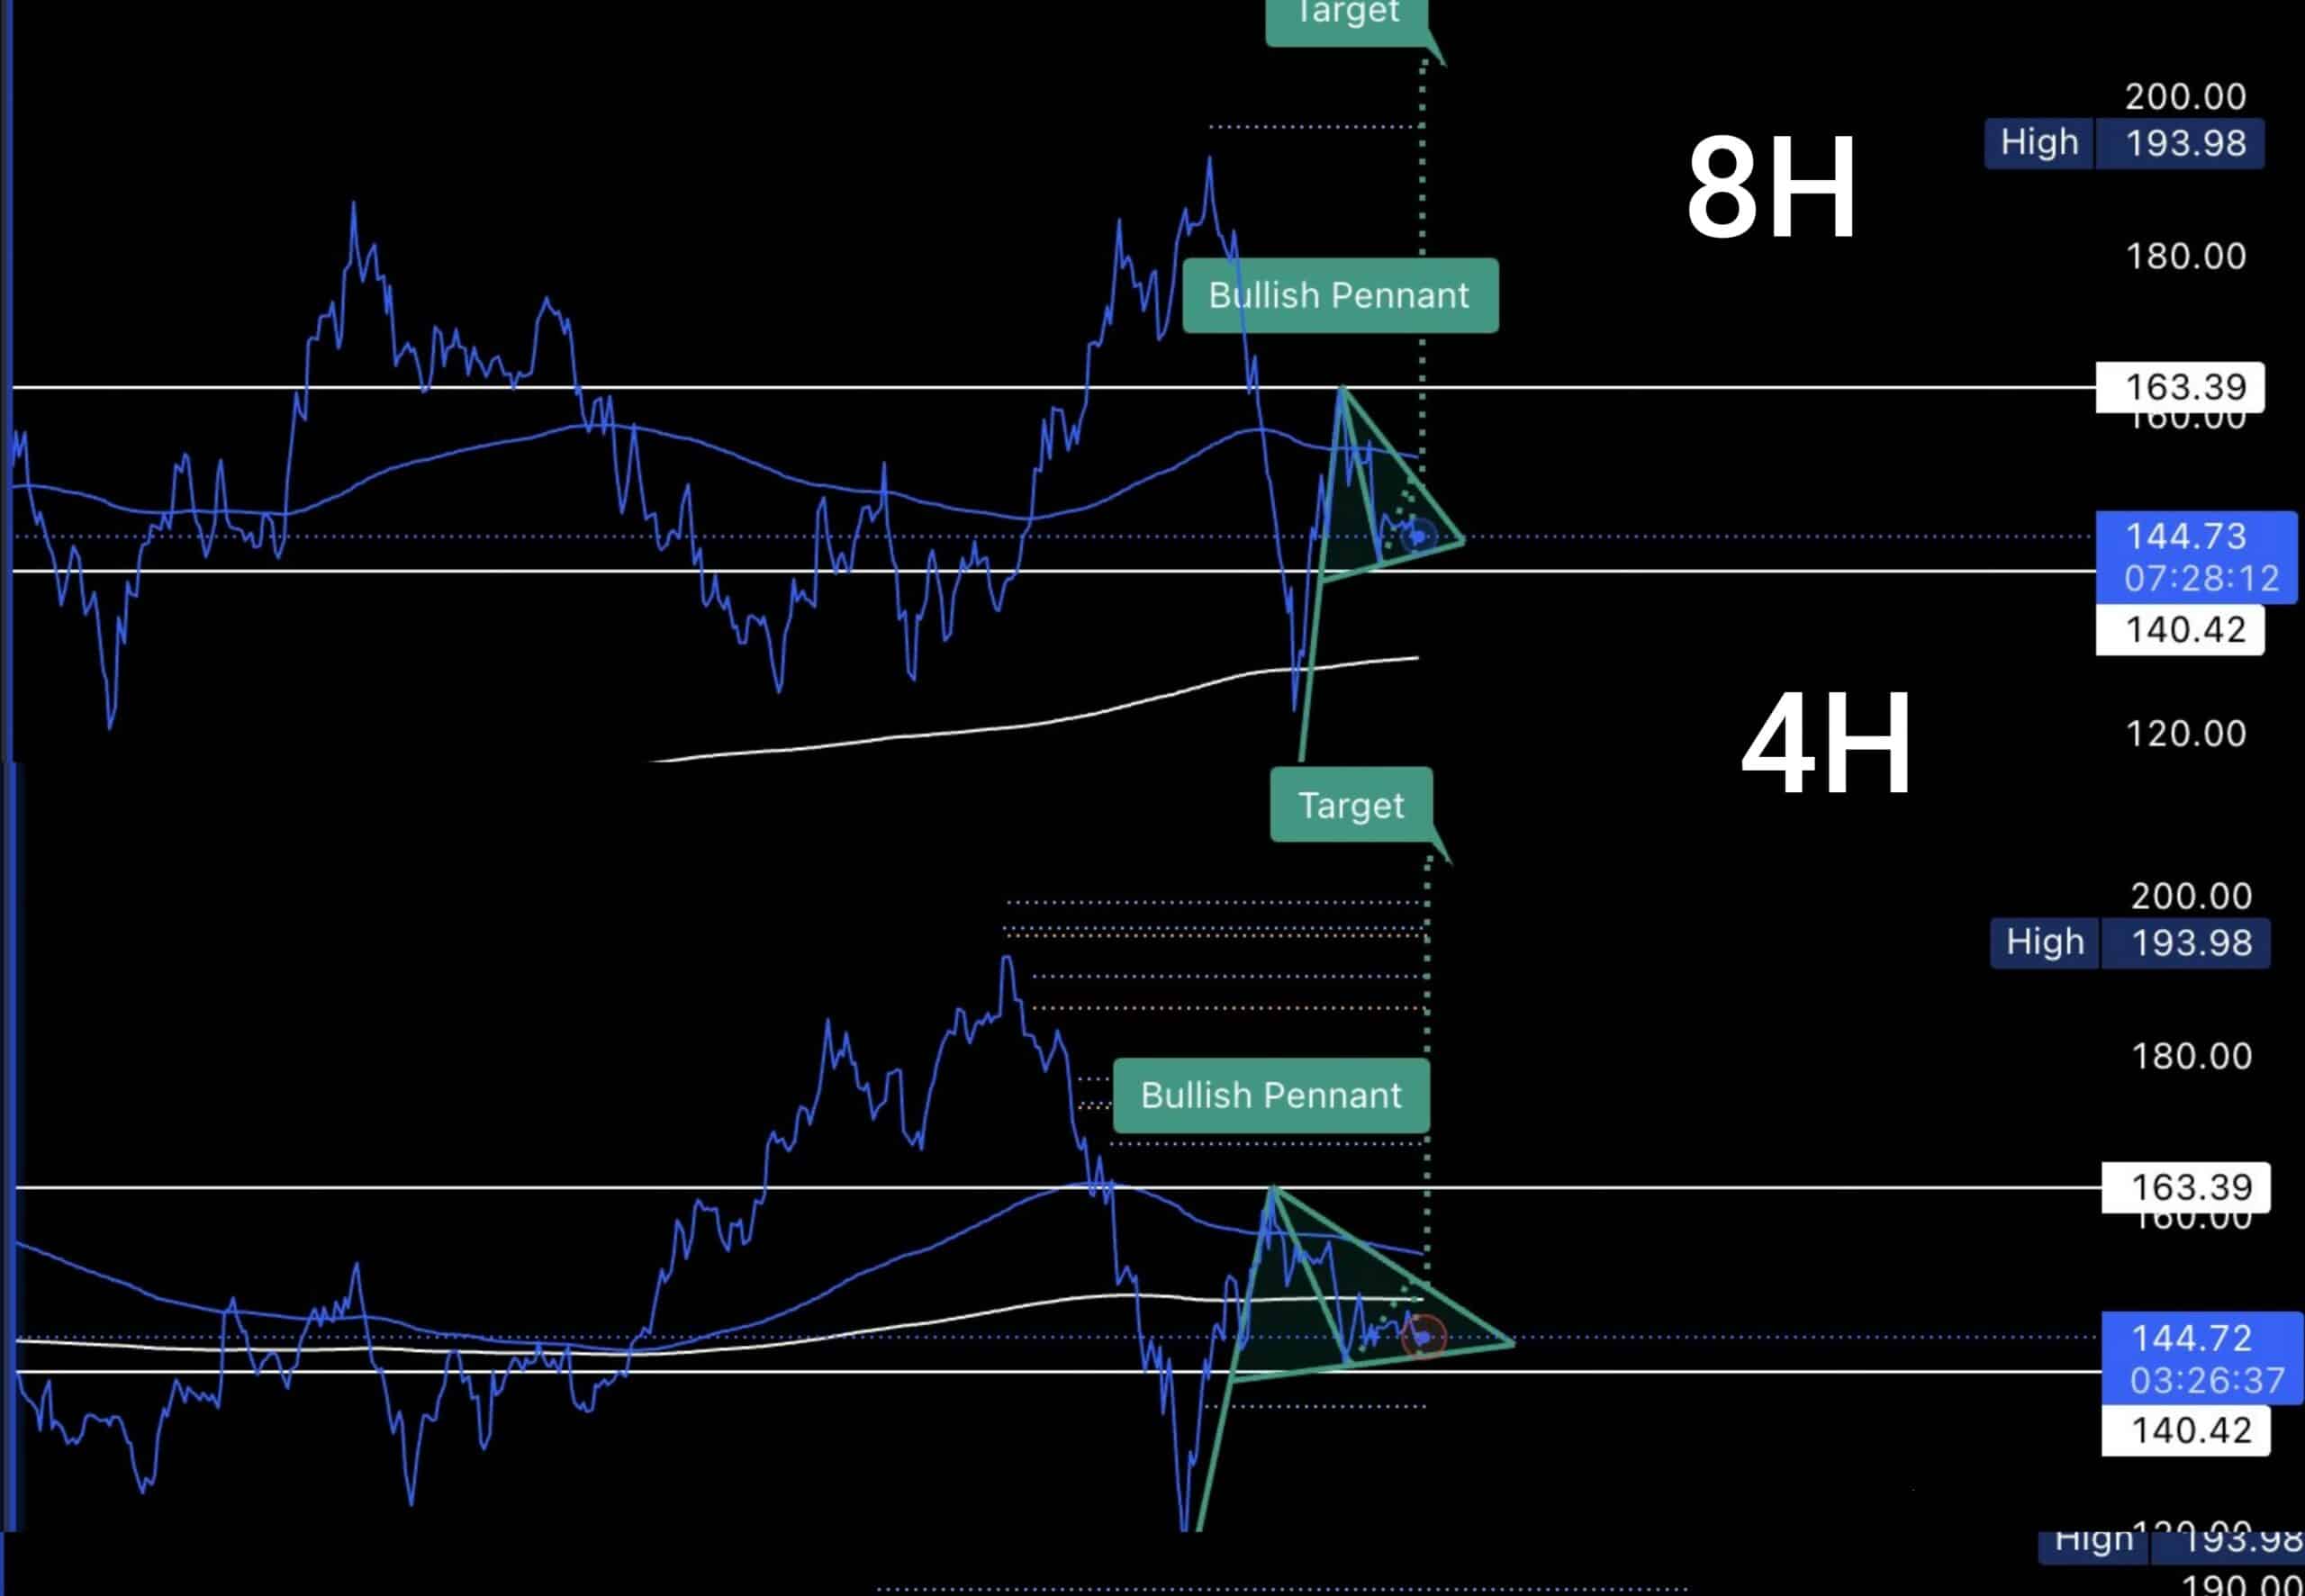
Source TradingView
History repeats itself as Open Interest rises significantly
Solana’s press time chart also closely mirrored Ethereum’s late 2020 pattern, which preceded Ethereum’s surge to new all-time highs.
If Solana follows a similar growth trajectory during this bull market, a $500 target for SOL would be reasonable.
History often repeats itself in crypto and financial markets. Hence, Solana could see significant gains similar to Ethereum’s past performance.
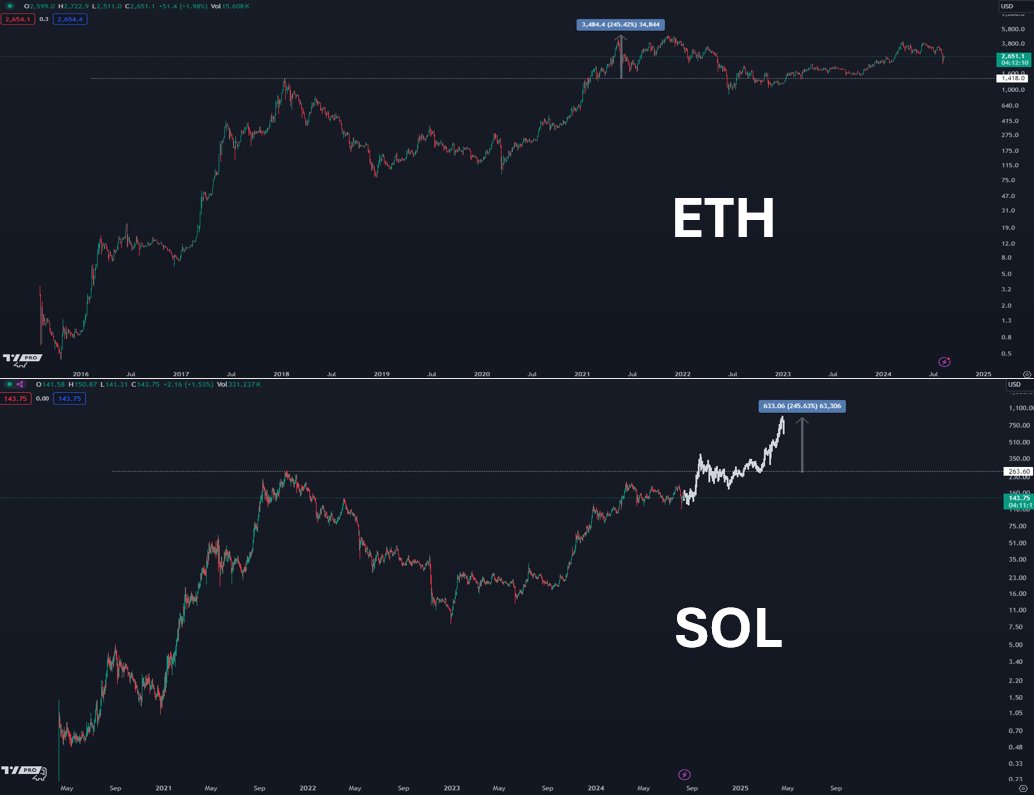
Source: TradingView
Finally, Solana’s Open Interest is higher now than it was a year ago, despite a recent drop in derivatives trading volumes.
With a notable 1.42% hike in OI today, Solana might be positioning itself for potential gains now. Looking ahead, expect further appreciation in these figures, which could drive SOL towards the $500 price level.
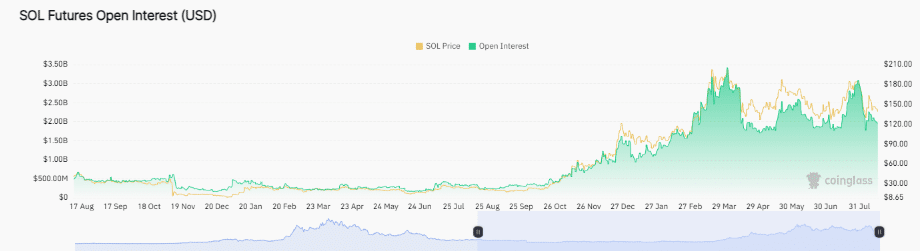
Source: Coinglass