
- Solana is likely to trade within a range over the next two weeks
- Indicators were bullish, but one chart showed price could dip to $165 soon
Solana [SOL] saw significant volatility over the last five days. The altcoin bounced from $167 to $185, making most of those gains in a single day on 21 July, Sunday. Since then, it has retraced those gains on the charts.
Its heightened volatility could be linked to the Ethereum [ETH] spot ETF approval and trading that began on 23 July. Speculation before the event that SOL would be next led to positive sentiment and gains, even though their collective impact didn’t last for long.
Bulls might defend the range lows
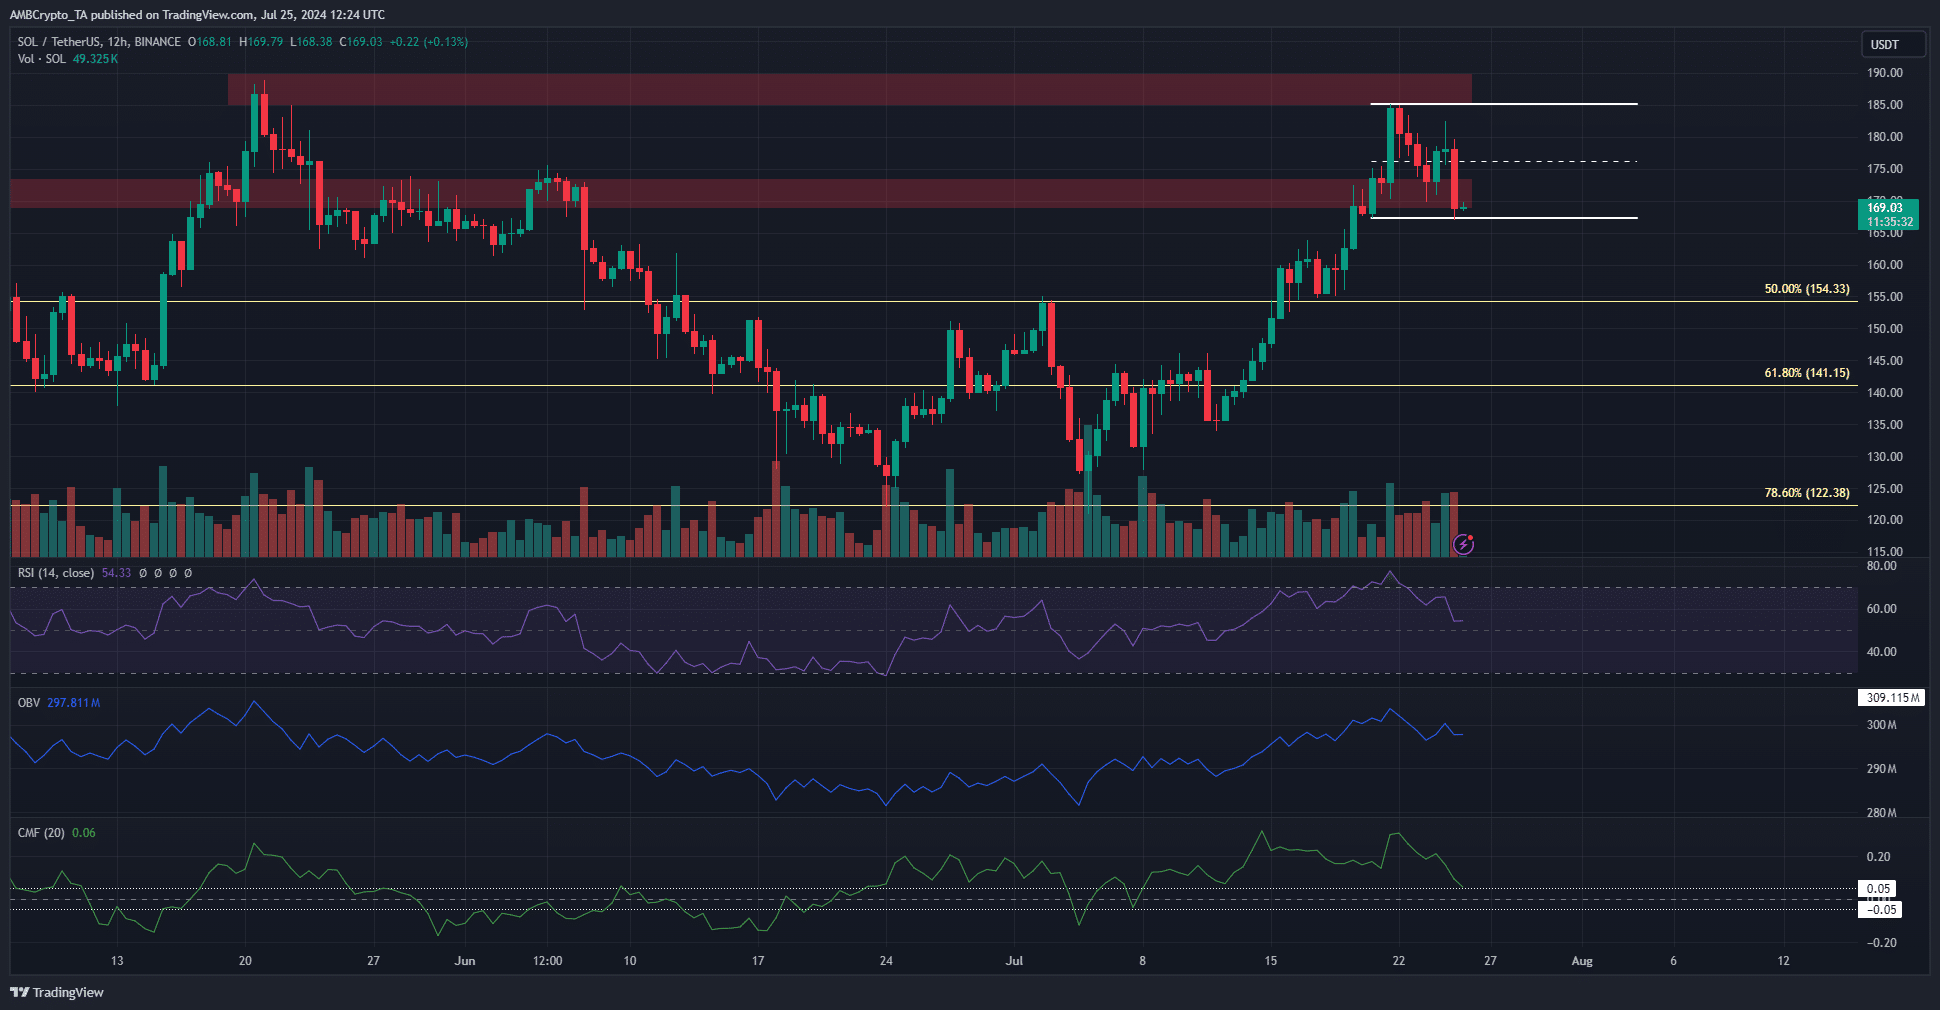
Source: SOL/USDT on TradingView
The RSI was above neutral 50 to reflect bullish sentiment. The OBV has been slowly climbing higher in July, and this trend hasn’t stopped despite the recent pullback. The CMF was above +0.05 to indicate steady, notable buying pressure.
These are the signals that swing traders can expect if the range lows are to be defended.
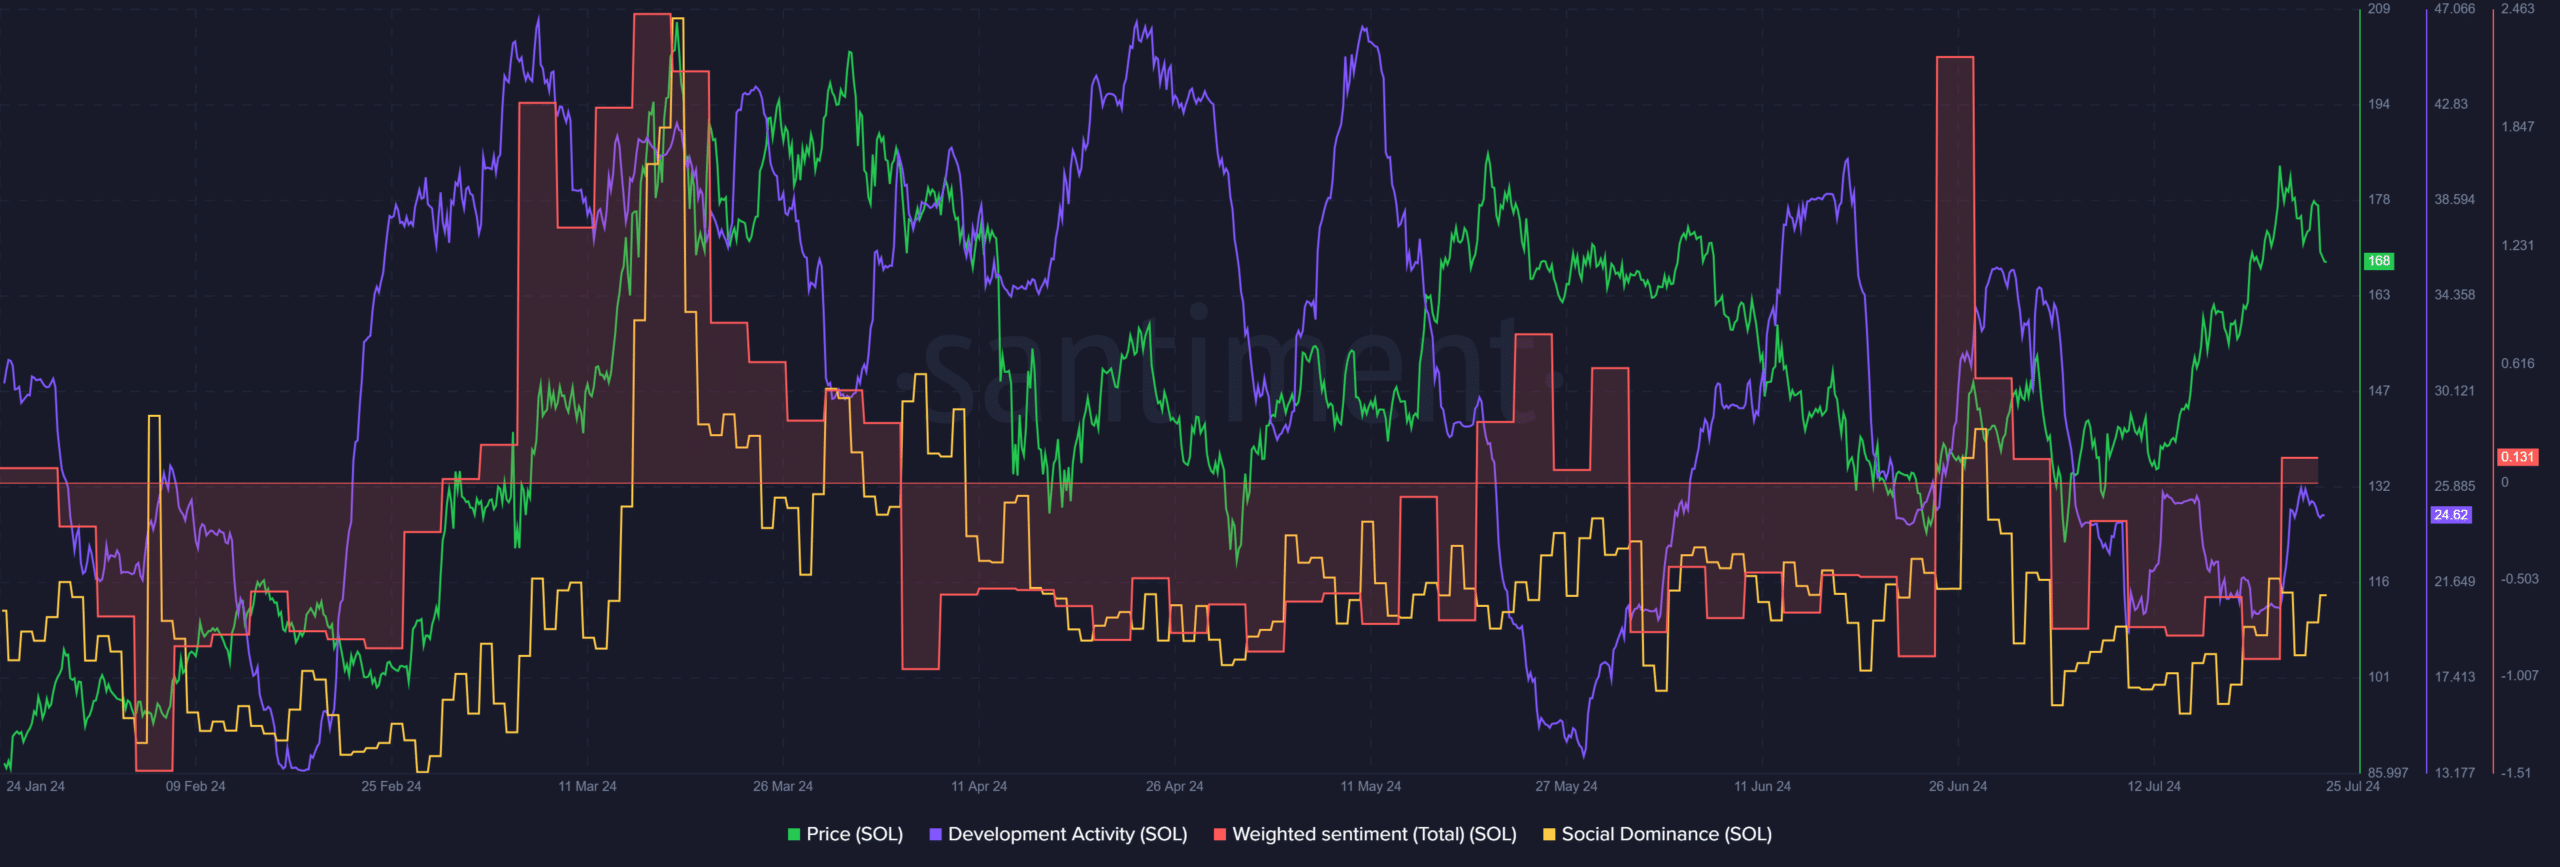
Source: Santiment
The development activity has fallen since June though. The metric’s 24.62 value was below Ethereum’s 44.95 and Cardano’s [ADA] 77.83 reading. On the contrary, the weighted sentiment jumped into the positive territory.
Combined with the technical findings, the metrics suggested that sentiment has picked up. A hike in SOL’s social dominance would help the bullish argument further, but at present, it seemed to add little.
Possibility of a Solana short-squeeze
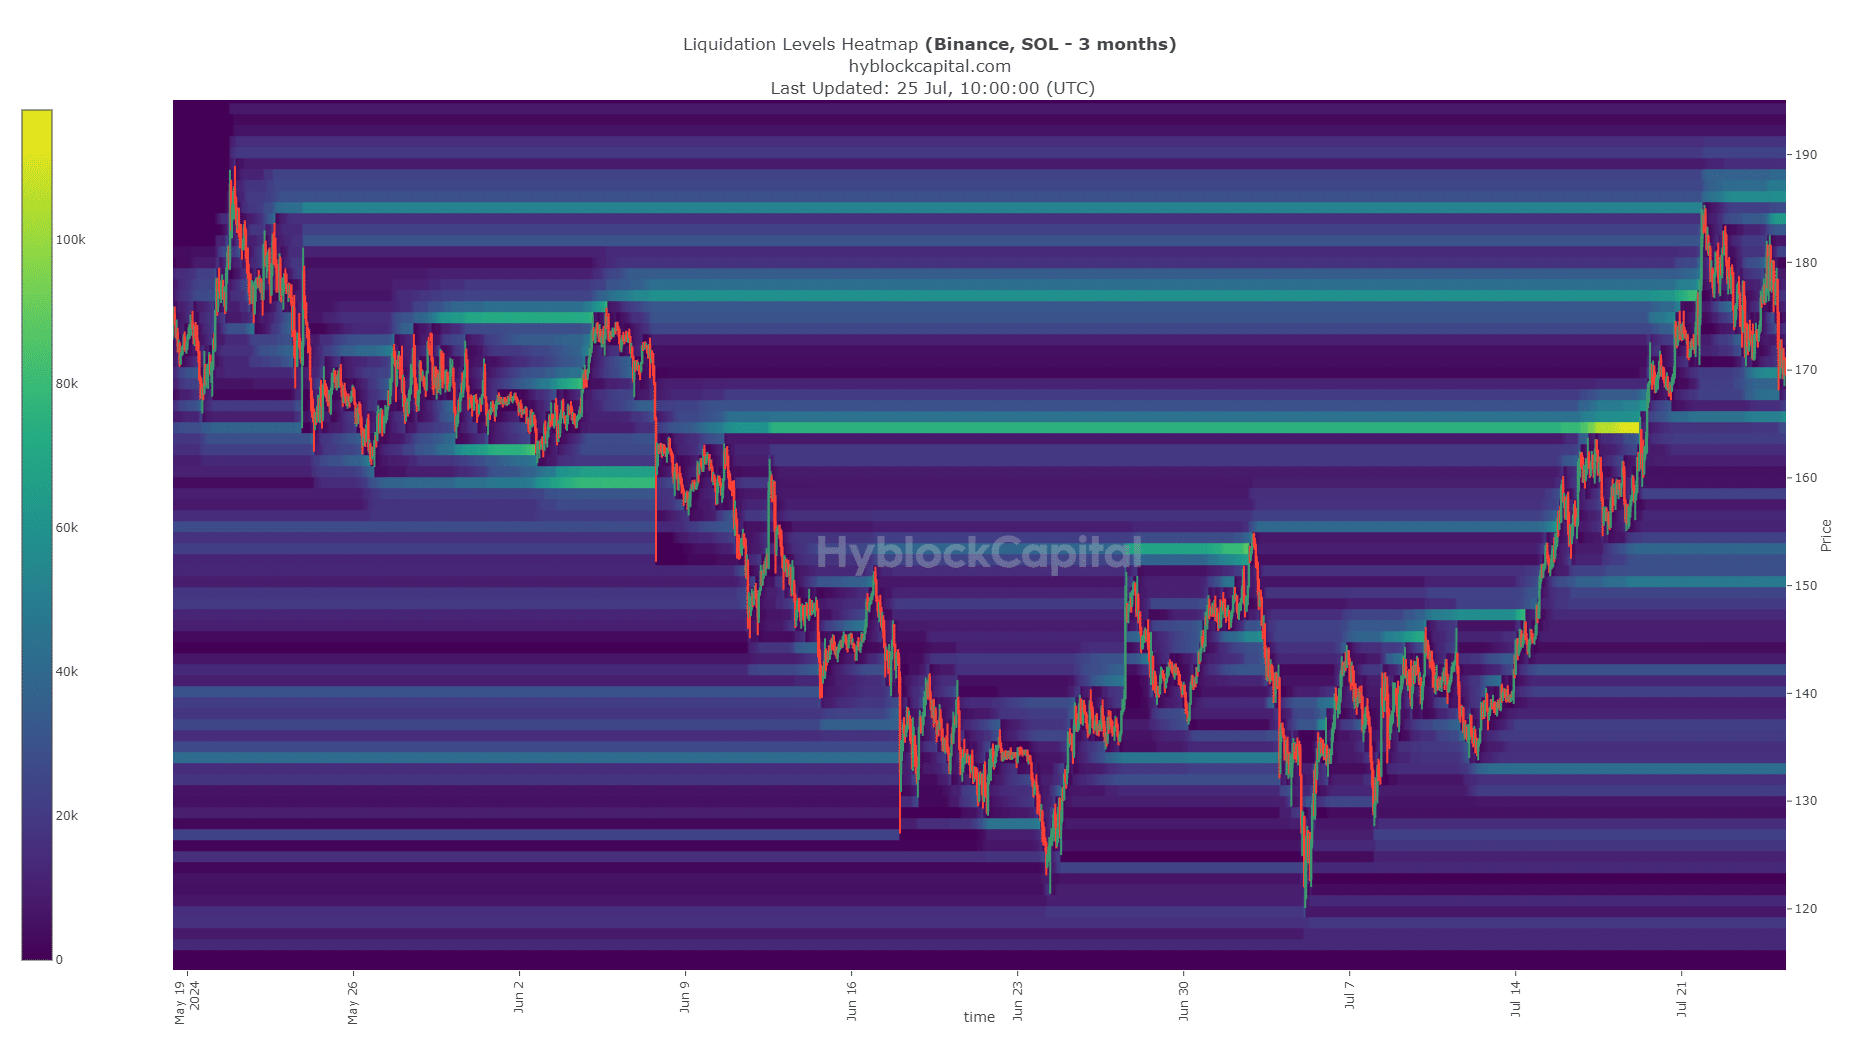
Source: Hyblock
The 3-month look-back period of the Solana liquidation heatmap highlighted $170 and $185 as the next zones of interest. The $165 and the $150-$155 levels are also potential places where a downtrend might reverse.
They have confluence with the technical support levels. The range formation is likely to continue since the $170 liquidity zone was swept, but indicators and sentiment were positive.
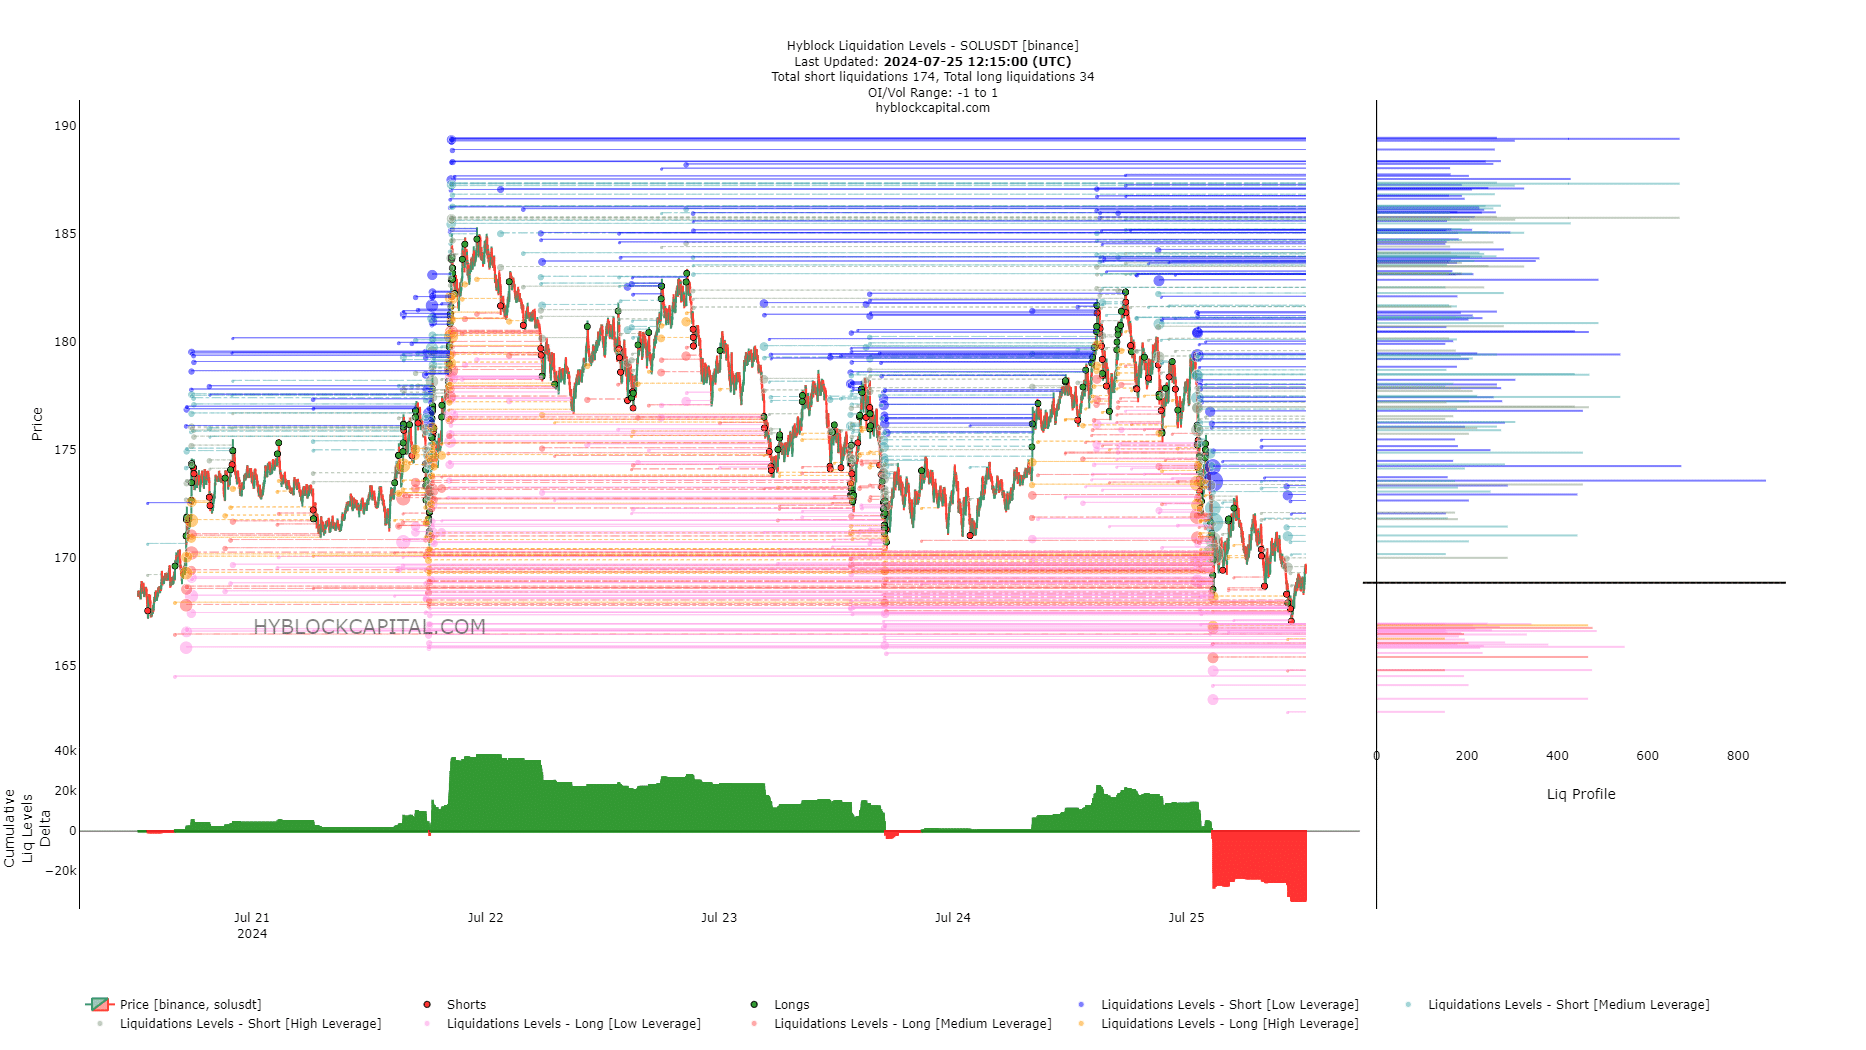
Source: Hyblock
The liquidation levels showed that there could be another twist to the story. The cumulative liquidation levels were growing more negative – A sign that short positions were increasingly dominant.
Realistic or not, here’s SOL’s market cap in BTC’s terms
If prices consolidate around the $165-$167 zone and attract more short-sellers, it would set up more short liquidations. A bullish short-term reversal could squeeze these short positions, resulting in a successful defense of the range lows.
Overall, traders can anticipate a price bounce around the $165 area but should also be prepared for the range to fail. Especially in case Bitcoin [BTC] is unable to hold on to $64,000.