- Popcat saw an uptick in volatility that could be good news for lower timeframe traders.
- The technical indicators showed upward momentum is likely to win soon.
Popcat [POPCAT] was on the verge of breaking out past a local resistance area that was also a fair value gap. The on-chain metrics showed that weighted sentiment was negative, but traders might have a profitable few days if POPCAT continues to trend higher.
The volatility of the past few weeks triggered a good deal of liquidations, with most of them being long positions in July. Here’s why the short-term outlook is bullish, even though Bitcoin faced resistance around the $60k territory.
Late buyers can wait for this to happen before bidding
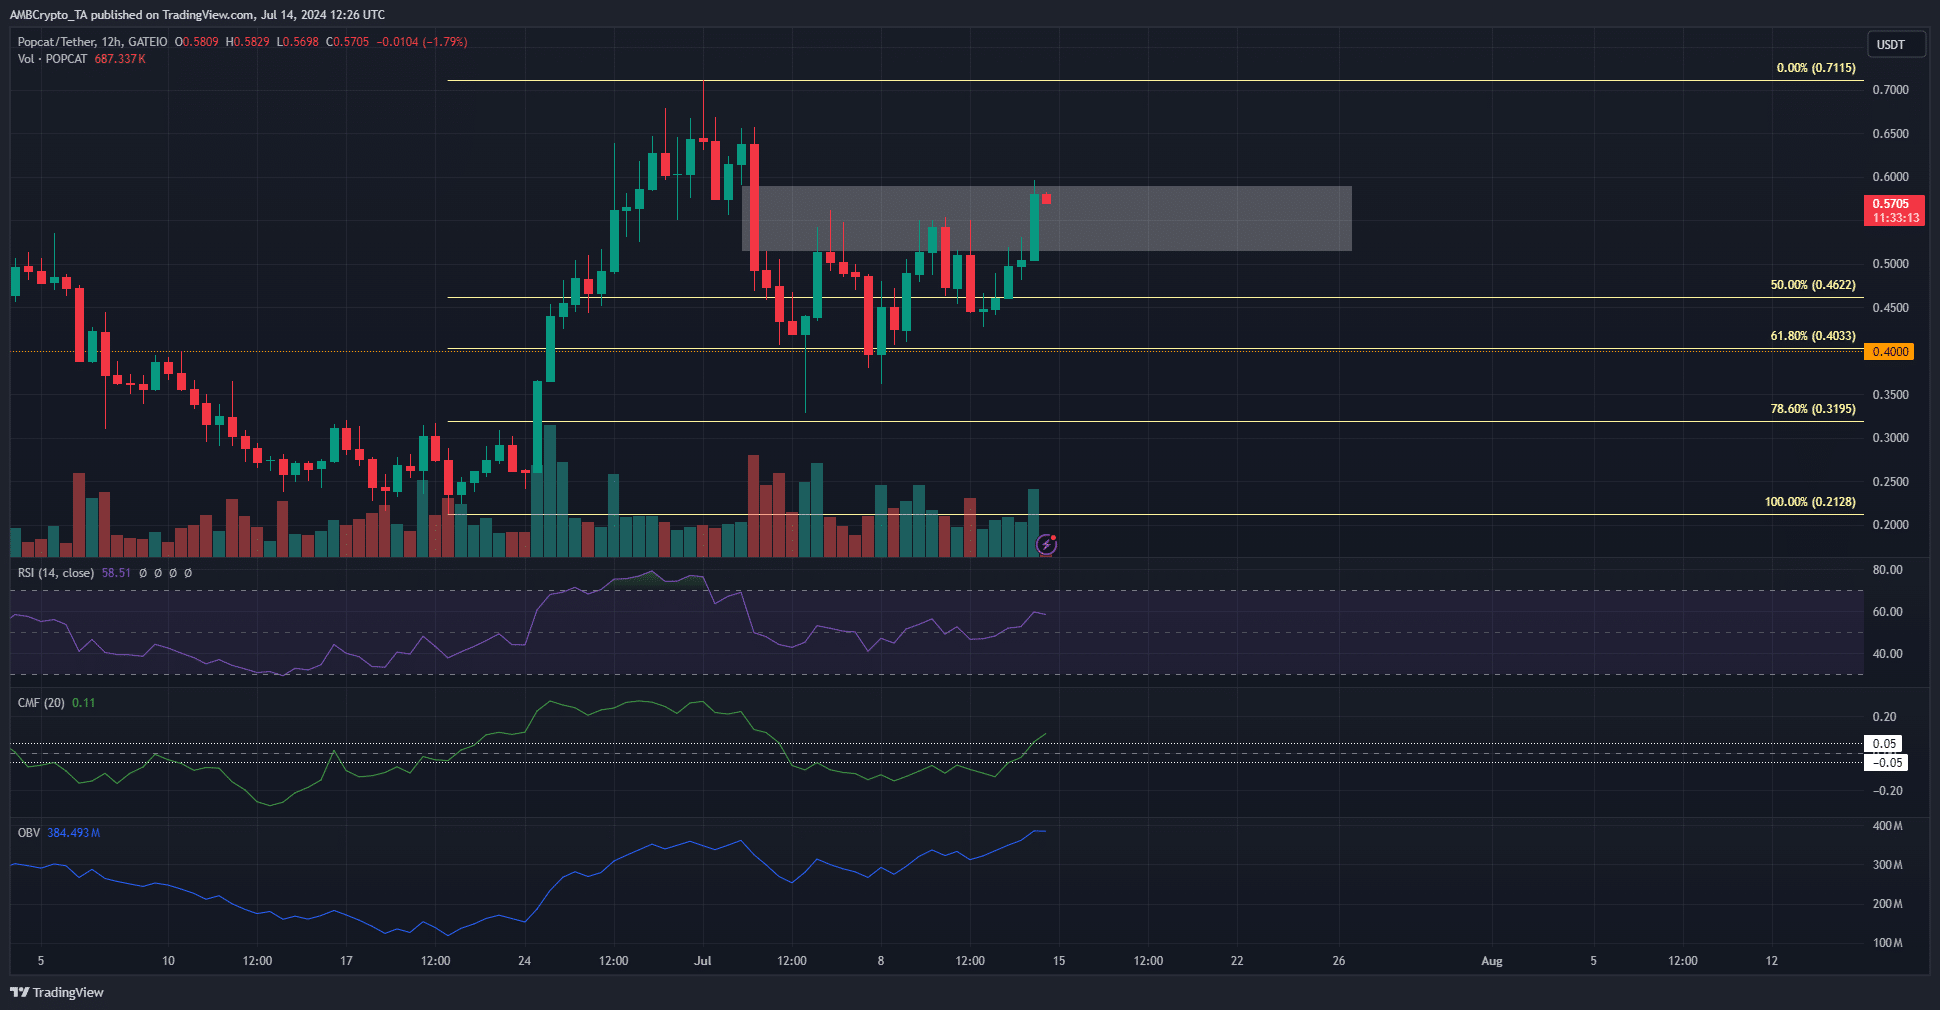
Source: POPCAT/USDT on TradingView
Based on the rally in late June, a set of Fibonacci retracement levels were plotted. The volatility in the past two weeks saw POPCAT retest the 61.8% and nearly test the 78.6% levels at $0.403 and $0.319 respectively.
On the 12-hour chart, the dramatic price plunge on the 3rd of July left behind a fair value gap (white box). This zone was likely to serve as resistance and might rebuff the bulls.
However, the OBV was trending higher despite the recent price retracement. The CMF was also rising above +0.05 to show strong capital inflows.
The momentum was also bullish with an RSI reading of 58, and signaled that the meme coin was likely to break out past the $0.59 resistance.
Exchange flow trends and sentiment at odds
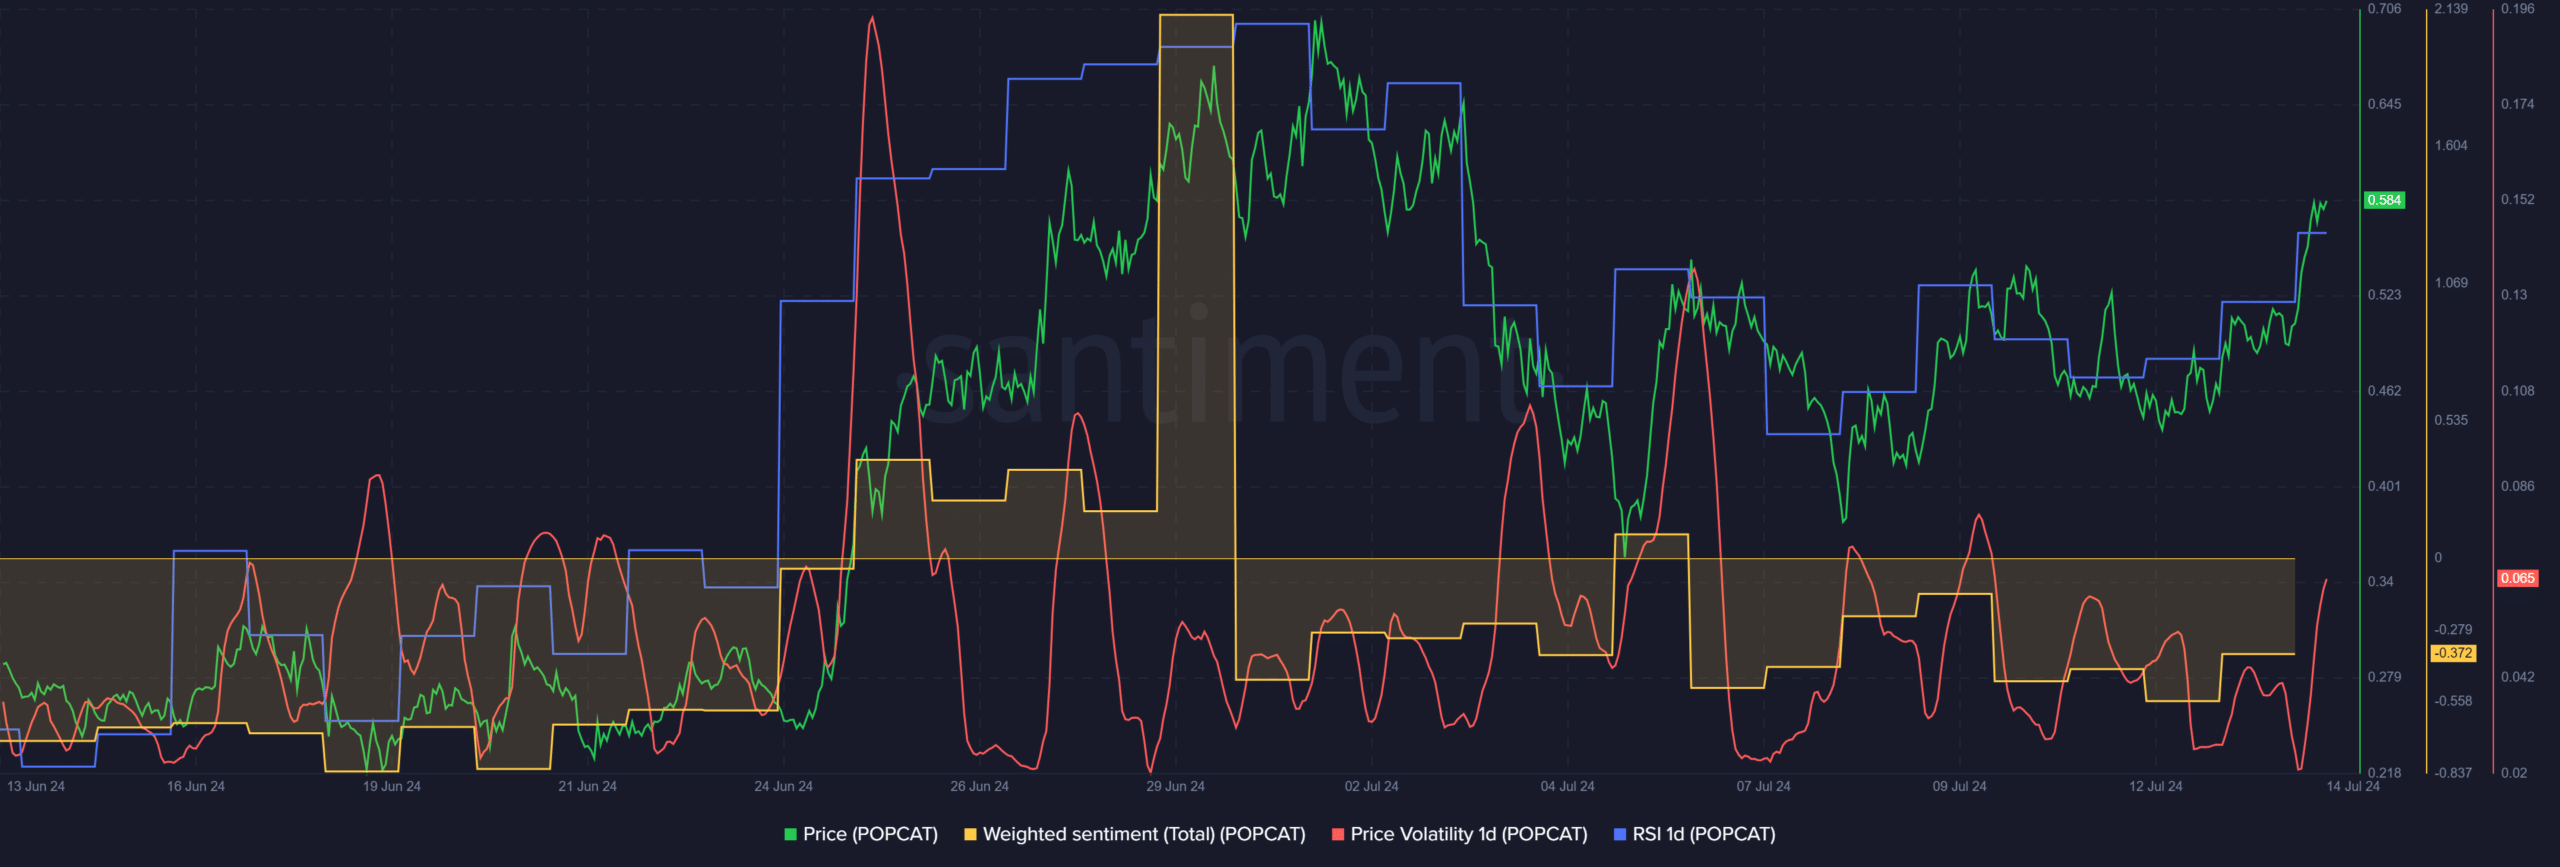
Source: Santiment
The weighted sentiment has been consistently negative over the past two weeks. The price volatility began to pick up over the past 24 hours as prices surged higher.
The daily RSI was at 62, and together it signaled that scalp traders can look to go long and ride the upward momentum for profits.
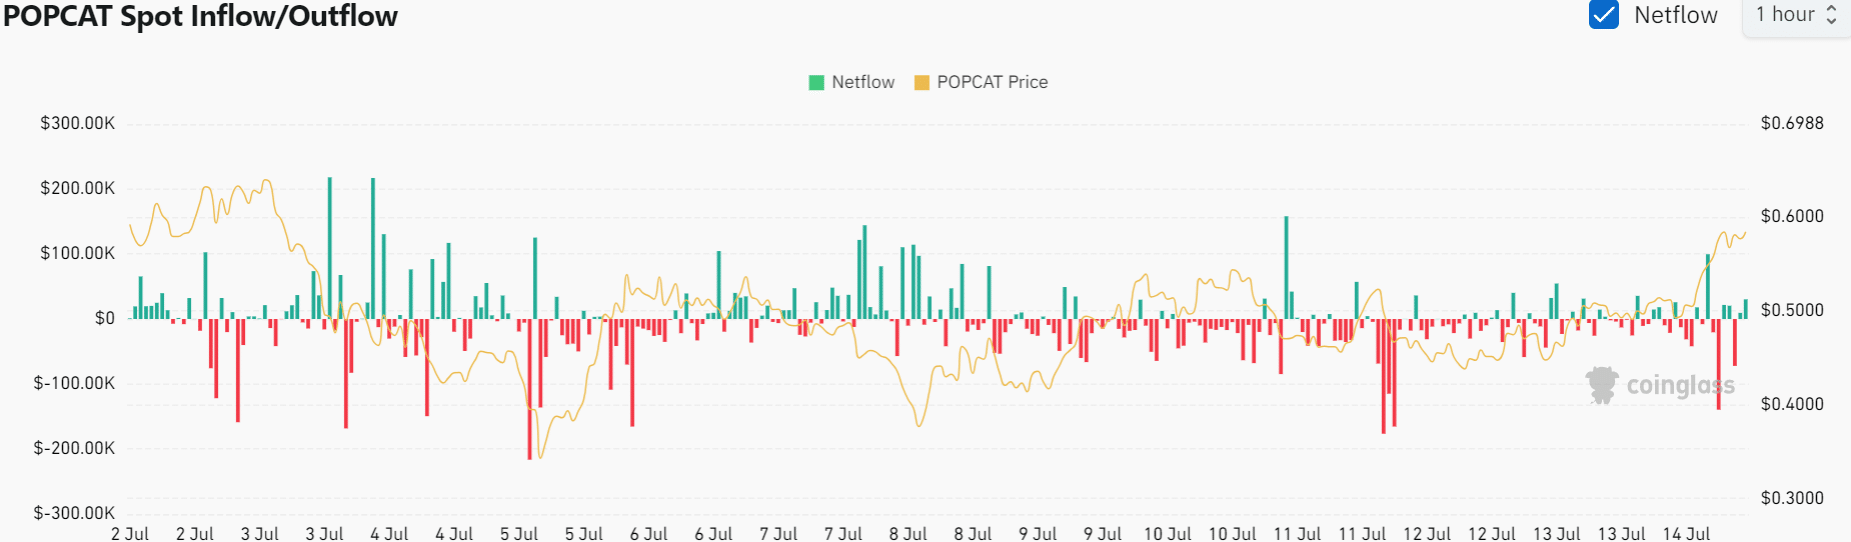
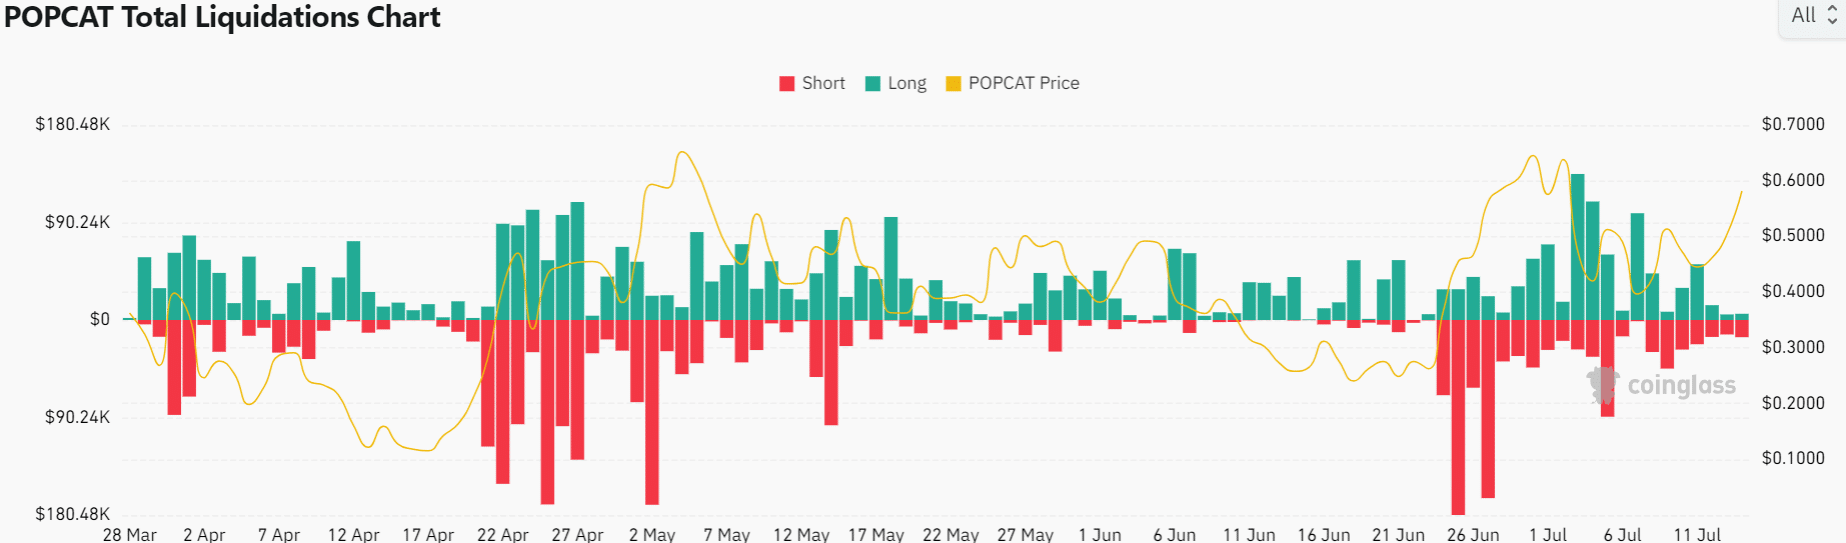
Source: Coinglass
The spot netflow chart showed over the past two days, even though the price slowly climbed higher, POPCAT wasn’t overwhelmingly deposited onto exchanges.
This meant there is a chance prices would continue to rally and that selling pressure was not a large hurdle.
Source: Coinglass
Read Popcat’s [POPCAT] Price Prediction 2024-25
The volatility saw both long and short positions decimated since the 26th of June. Traders can keep an eye on this chart when the token climbs above $0.6.
A flurry of short liquidations can cause a price surge, which scalp traders can use to take profits.