Solana’s roadmap to $170 – What SOL traders need to know
Several factors signaled that the bulls have a chance of climbing past the $155 resistance to hit $170.

- The 78.6% retracement level at $122 has been defended since April, marking the higher timeframe bias as bullish.
- The gains of the past three days meant SOL is on the verge of establishing a bullish structure.
Solana [SOL] noted gains over the weekend as Bitcoin [BTC] also jumped back above the $60k resistance. Analysts maintain a favorable view of SOL, with one prominent crypto analyst projecting a price target of $950.
Separately, the network’s new, independent client, Firedancer, reached a notable testnet milestone. Its mainnet debut is set for Q4 2024, buoying bullish hopes.
The $155 resistance zone is under siege
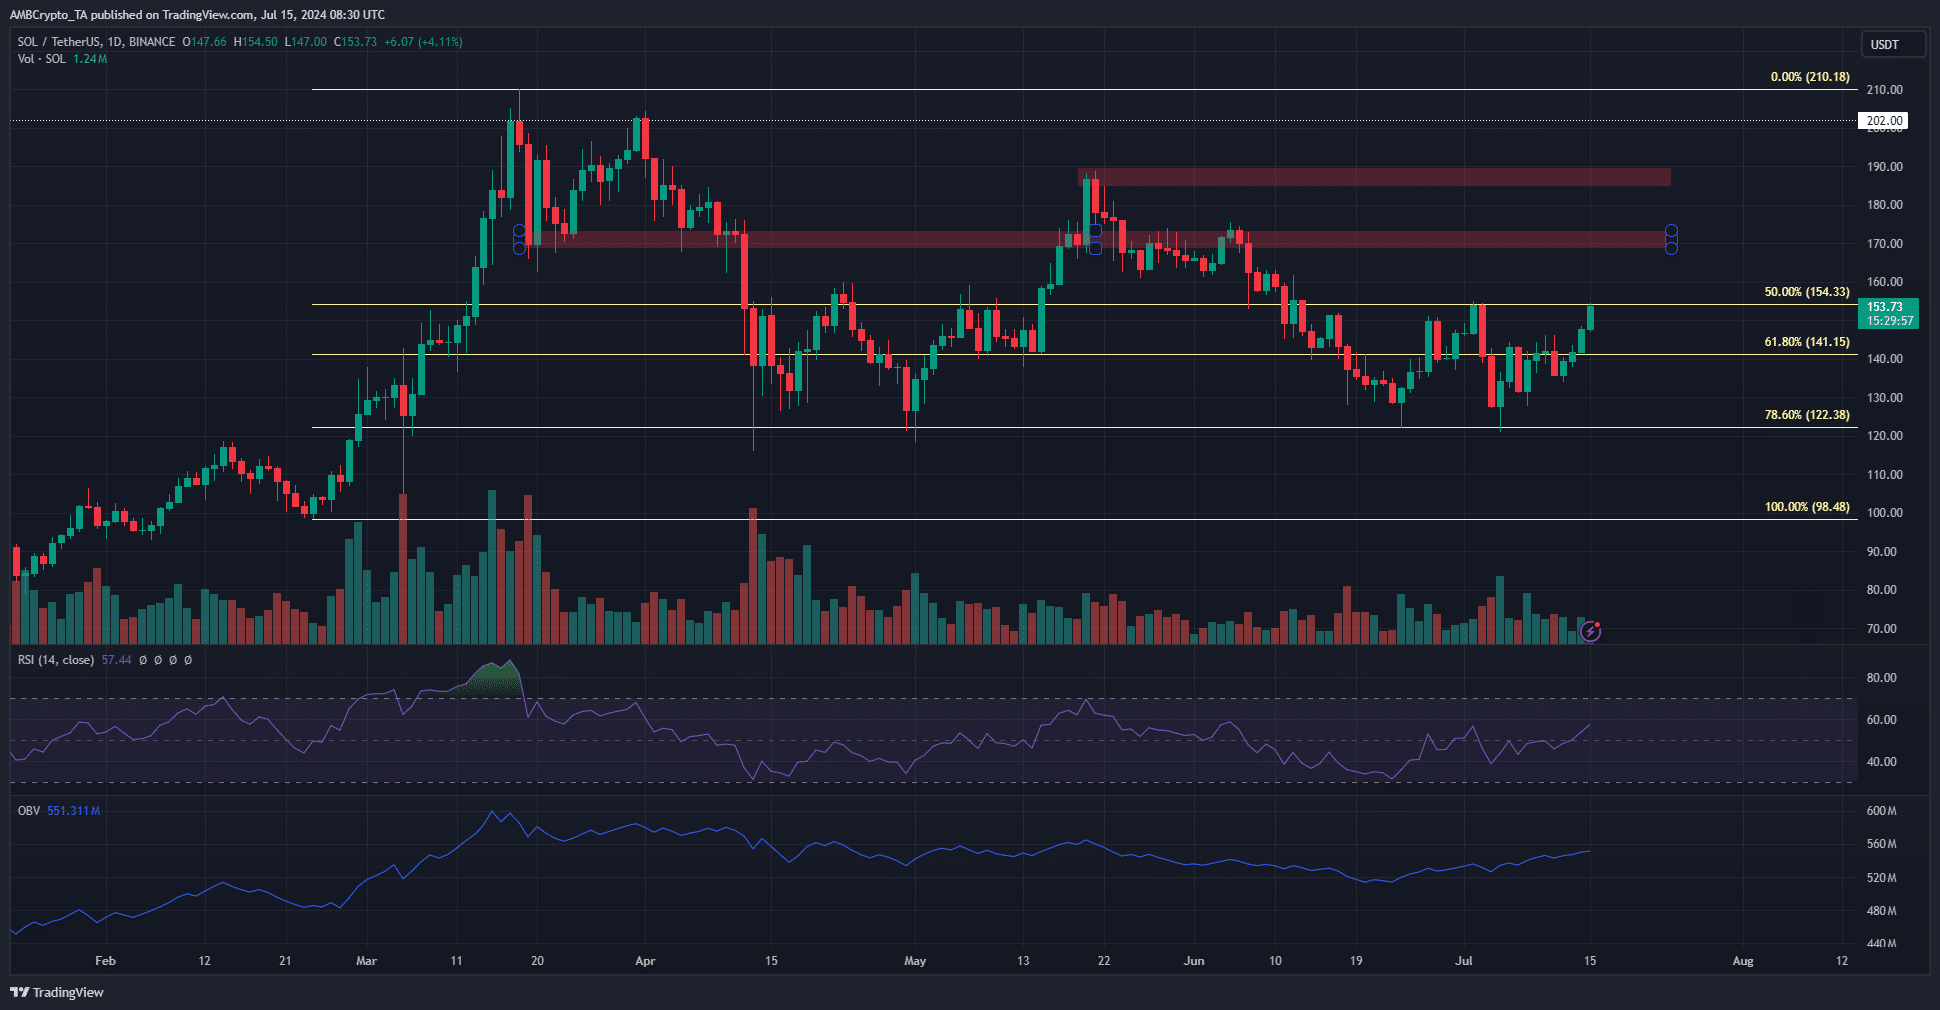
On the 1-day chart, the market structure was not yet bullish, but it was close. A daily session close above the recent lower high at $155 will be an early sign of a shift.
When the price forms a higher low after achieving this, the trend is said to be changing.
The RSI climbed to 57 at press time to reflect sustained bullish momentum. The OBV has also climbed higher over the past three weeks. These factors signaled that the bulls have a chance of climbing past the $155 resistance.
To the north, the $170 and $187 supply zones need to be beaten to sustain a long-term uptrend.
Solana bullish sentiment picking up speed
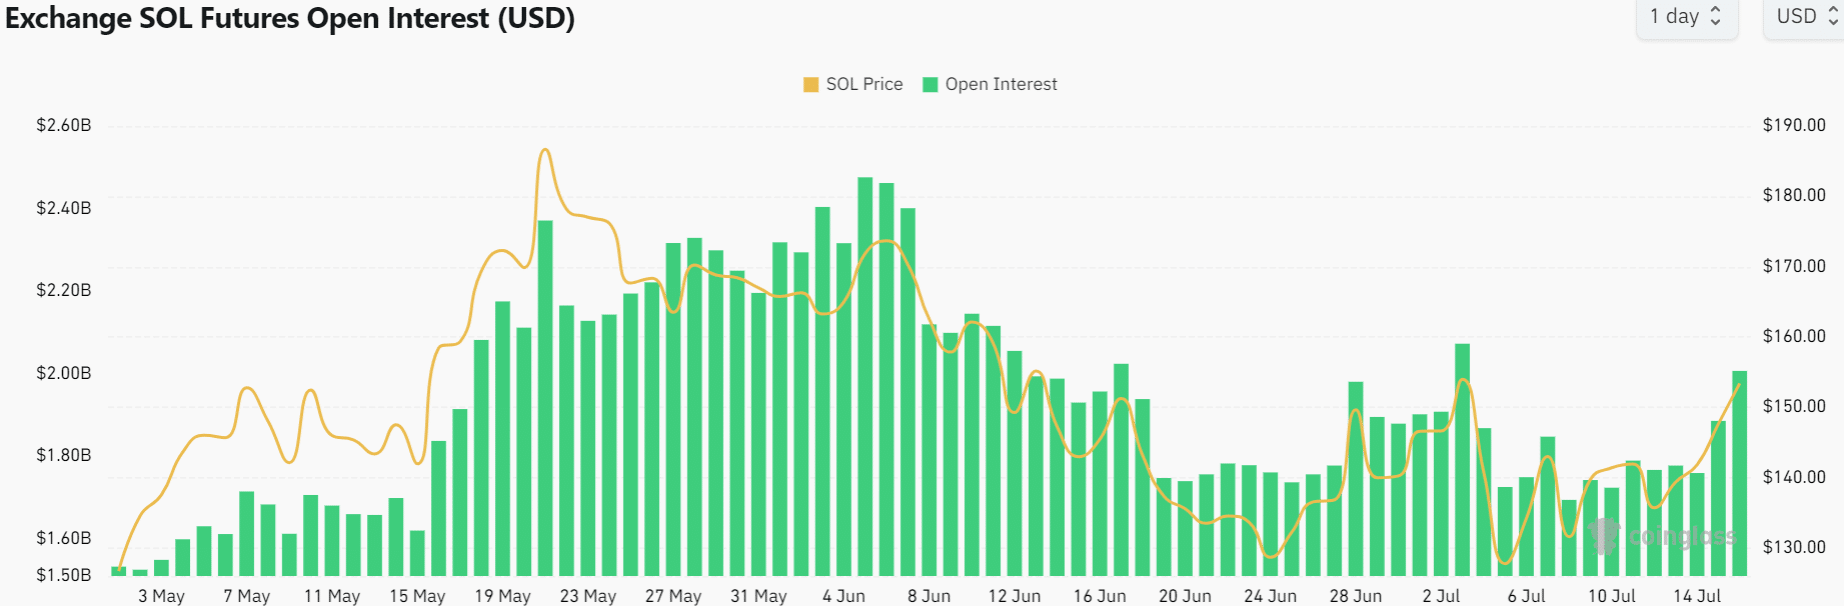
Over the past few days, the Open Interest behind Solana has surged from $1.69 billion to $2.01 billion. This meant speculators were eager to go long on SOL especially as Bitcoin also has healthier short-term prospects.
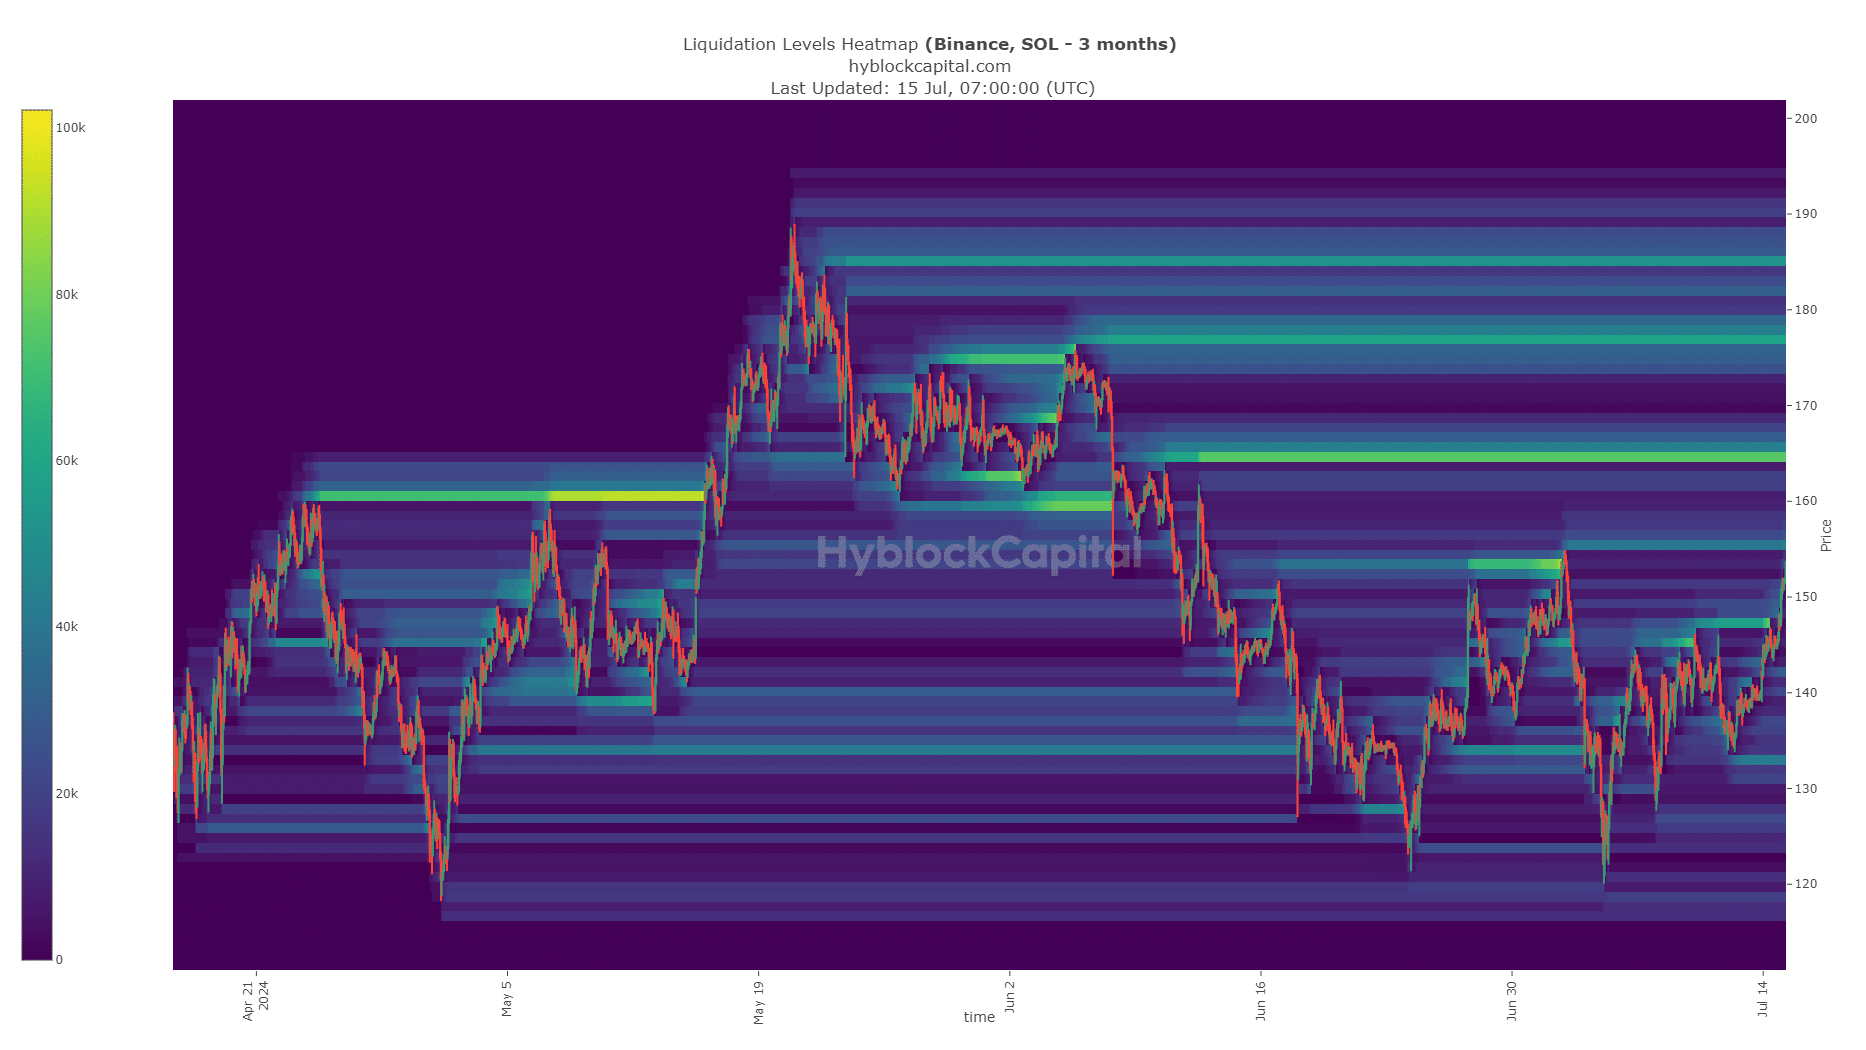
Analysis of the liquidation heatmap showed that the $155, $165, $177, and $185 are the next zones to watch that can trigger sizeable short liquidations.
Among them, the $165-$168 zone was the biggest liquidity cluster.
Is your portfolio green? Check the Solana Profit Calculator
Given the momentum and sentiment, a move toward $170 appeared likely. Whether further gains will follow is unknown, but bulls can prepare for a move as far north as $185. This is because of the build-up of liquidity to the north, for Solana as well as Bitcoin.
The latter could rise to $73k before deciding whether to continue the rally or temporarily reverse, strengthening SOL’s bullish chances.
Disclaimer: The information presented does not constitute financial, investment, trading, or other types of advice and is solely the writer’s opinion.