Solana’s struggle with $160-level: Should you count on a recovery?
The $150 and $160 magnetic zones to the north could be bullish targets for Solana traders.

- Solana is expected to bounce higher shortly and establish a range
- Market turbulence could drag prices below the key support level just below the current market price
Solana [SOL] faced rejection at an imbalance at the key $160 resistance level last week. There was some hope for long-term investors as the user activity metrics remained high in recent weeks.
However, a recent AMBCrypto outlined that a good chunk of the activity was from MEV bots. This could be problematic because it can negatively impact user experience. Can the SOL bulls fight past these challenges? Or is the fear that blankets the crypto ecosystem right now too thick to cut through?
The imbalance forced bulls to retreat toward $120
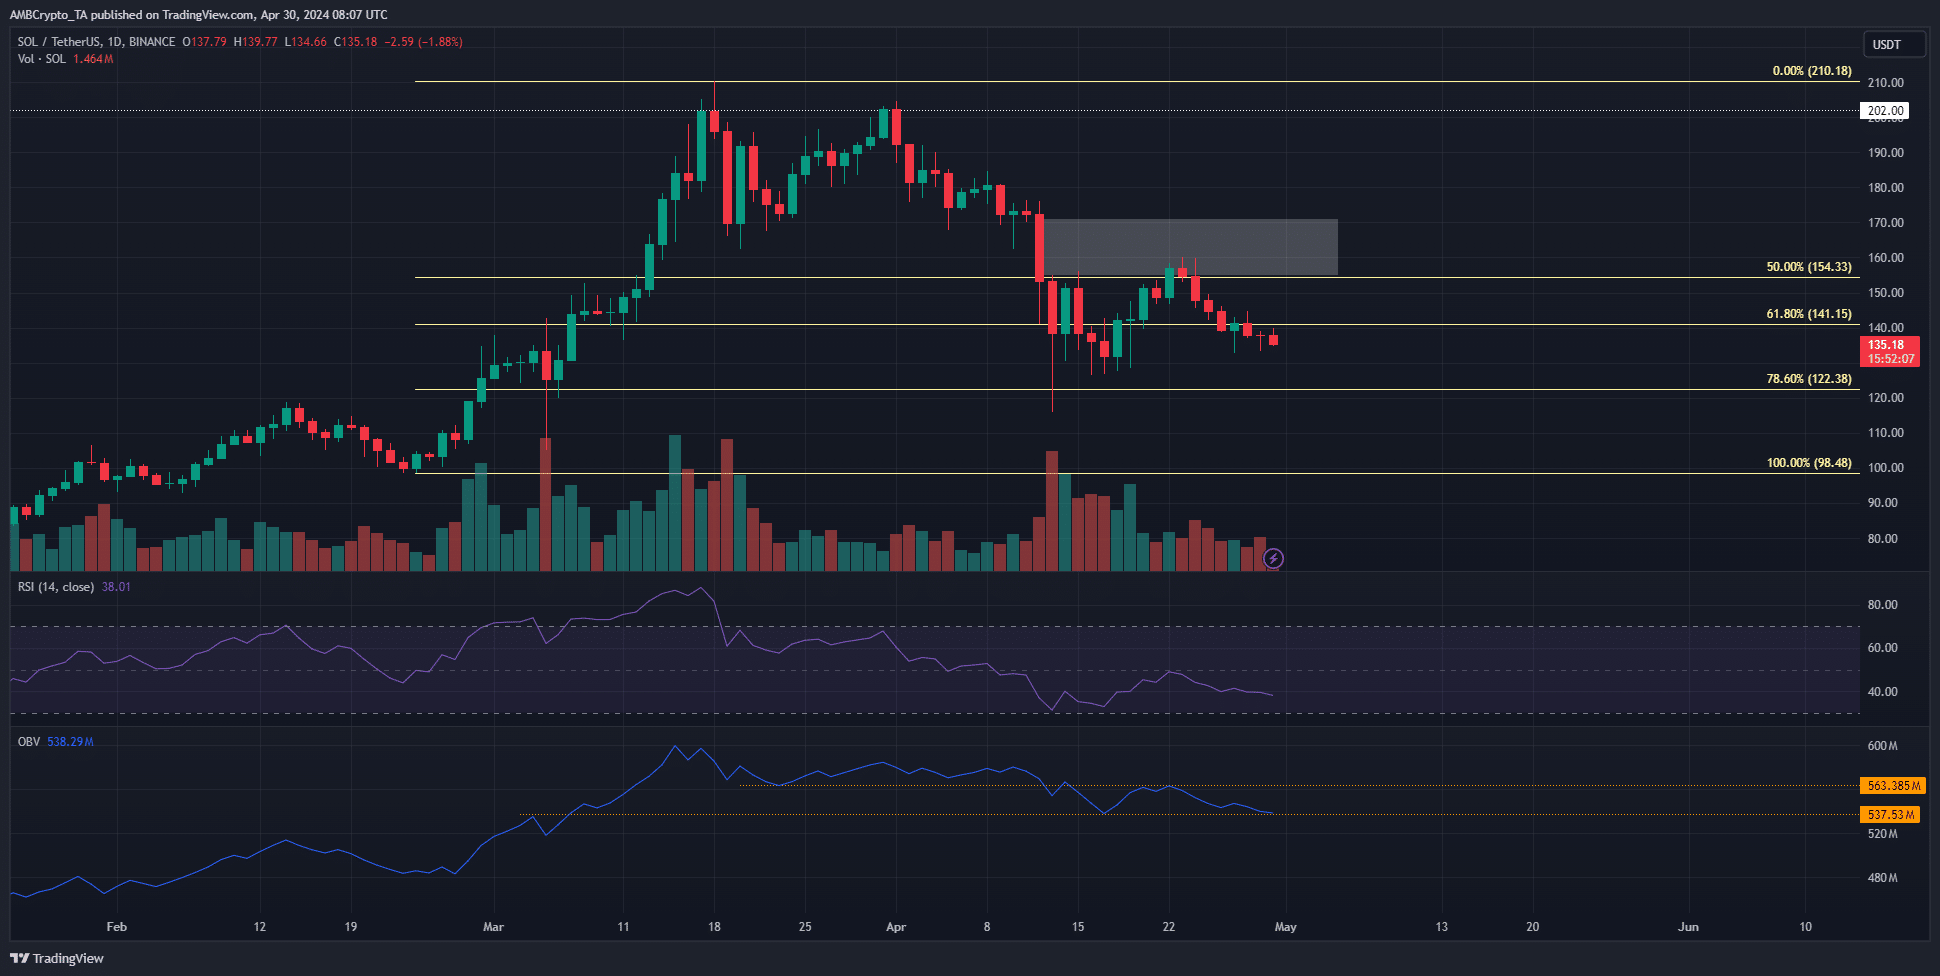
The higher timeframe market structure of SOL was bullish after the March rally to $210. However the recent retracement meant that the internal structure was bearish.
The rejection at the fair value gap (white box) at the $160 resistance showed bullish sentiment was weak.
The RSI on the 1-day chart has been below neutral 50 for most of April to denote strong bearish momentum. The OBV was also in a downtrend since mid-March. At press time, it was just above another local support level.
An OBV drop below this level would indicate further losses were inbound. In that scenario, Solana prices could fall toward the $98.38 swing low or possibly even lower.
Until then, the $122.38 Fibonacci support level is expected to yield a positive response.
Bullish and bearish targets based on liquidity pools
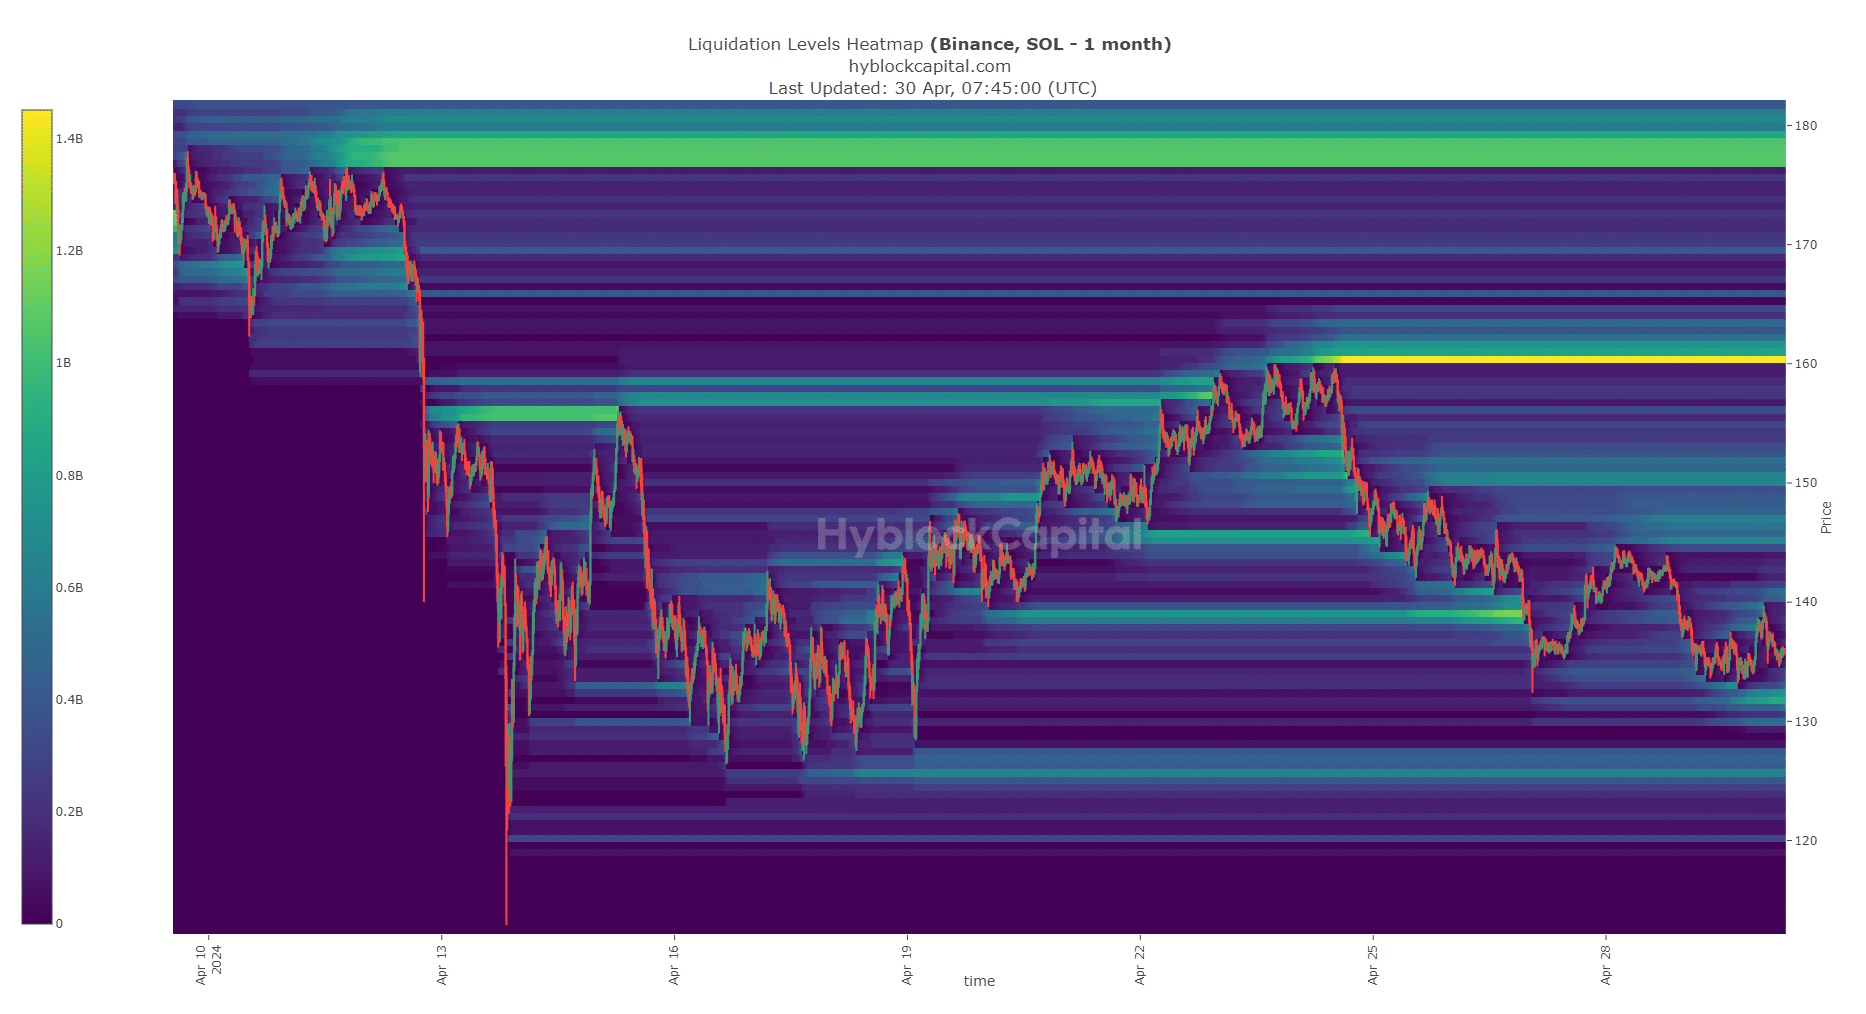
The findings from the technical analysis went well with what AMBCrypto found from the liquidation heatmap. Hyblock data showed that the $132 and $125 regions were the next short-term support zones.
These liquidity pockets could be swept before a move higher. To the north, the psychological $150 level and the $160 level were the magnetic zones for bulls to take profits at.
Is your portfolio green? Check the Solana Profit Calculator
Yet, Bitcoin volatility could spark a sudden wave of negative sentiment. This might push SOL below the $122 mark.
Hence, there is a swing trading buy opportunity present targeting $160. A drop below $122 would invalidate the idea.
Disclaimer: The information presented does not constitute financial, investment, trading, or other types of advice and is solely the writer’s opinion.


