Sonic’s rally has a money flow problem – THIS level decides what’s next for S
Indicator analysis shows that a rally is possible, but significant risks remain.


![Sonic [S] had surged double-digit percentages in the past day as investors continued to buy the asset in the market, but the real test still remains. This is based on the current price structure the asset is trading in, known as the cup and handle pattern, which has often preceded a rally on multiple occasions. The bullish pattern often materializes when price is able to overcome the resistance level in the form of the neckline pattern that is currently ahead of it. A surge above this resistance level would imply that market momentum is sufficient to continue expanding higher. Source: TradingView There are two levels of interest from this point onward. First is the closer target, which is $0.049 on the chart, 15% from the neckline, while the deeper stretch would see price rally 35% to $0.0586. Price must break above the neckline to establish the bullish run. If sellers reject the price at this level, the asset could consolidate around the neckline and form a broader handle pattern or decline and invalidate the setup. MACD and MFI reveal mixed signals The rally remains broadly conditional based on indicator analysis using the Moving Average Convergence Divergence (MACD) and the Money Flow Index (MFI). MACD carries more weight in the condition here, as the indicator is attempting to form a bullish pattern known as the "Golden Cross" when the blue MACD line crosses over the Orange Signal Line. Currently, the blue line is slightly below the Orange Signal Line, with readings of 0.00304 compared to 0.00301. A flip above this could kickstart a much broader bullish trend. Source: TradingView The MFI warns of a much broader risk of a potential decline in price based on the recent drop. The drop signals that there has been a massive outflow of capital for the past couple of days. When capital exits the market at this pace, investors may be taking profits or turning bearish. The former seems to be the case as the MFI remains in the positive zone, anywhere between 50 and 80. At the moment, the MFI has a reading of 57.4. The rally may not materialize in the near term unless the MFI turns higher and the MACD forms a golden cross pattern. Long volume supports Sonic’s bullish outlook The Long/Short Ratio on the chart, which records market volume and sees whether long or short volume takes the upper hand, indicates there is a bullish outlook. According to the chart, long volume accounts for 53% of Sonic’s perpetual market, compared with 47% for short volume. This means there has been more bullish activity in the market. Source: CoinGlass The volume has been long dominant across the top three crypto trading venues where buying activity occurs in the market. The sustained buy volume could impact price, pushing it higher in the near term and helping it overcome the neckline resistance. Final Summary Sonic’s cup and handle pattern points to a potential breakout toward $0.049 and $0.0586. MACD and MFI must strengthen to support the rally and confirm bullish momentum.](https://ambcrypto.com/wp-content/uploads/2026/10/Abdul4-960x540.webp)
Sonic [S] had surged double-digit percentages in the past day as investors continued to buy the asset in the market, but the real test remains.
This is based on the current price structure the asset is trading in, known as the cup and handle pattern, which has often preceded a rally on multiple occasions.
The bullish pattern often materializes when price overcomes the resistance level in the form of the neckline pattern that is currently ahead of it. A surge above this resistance level would imply that market momentum is sufficient to continue expanding higher.
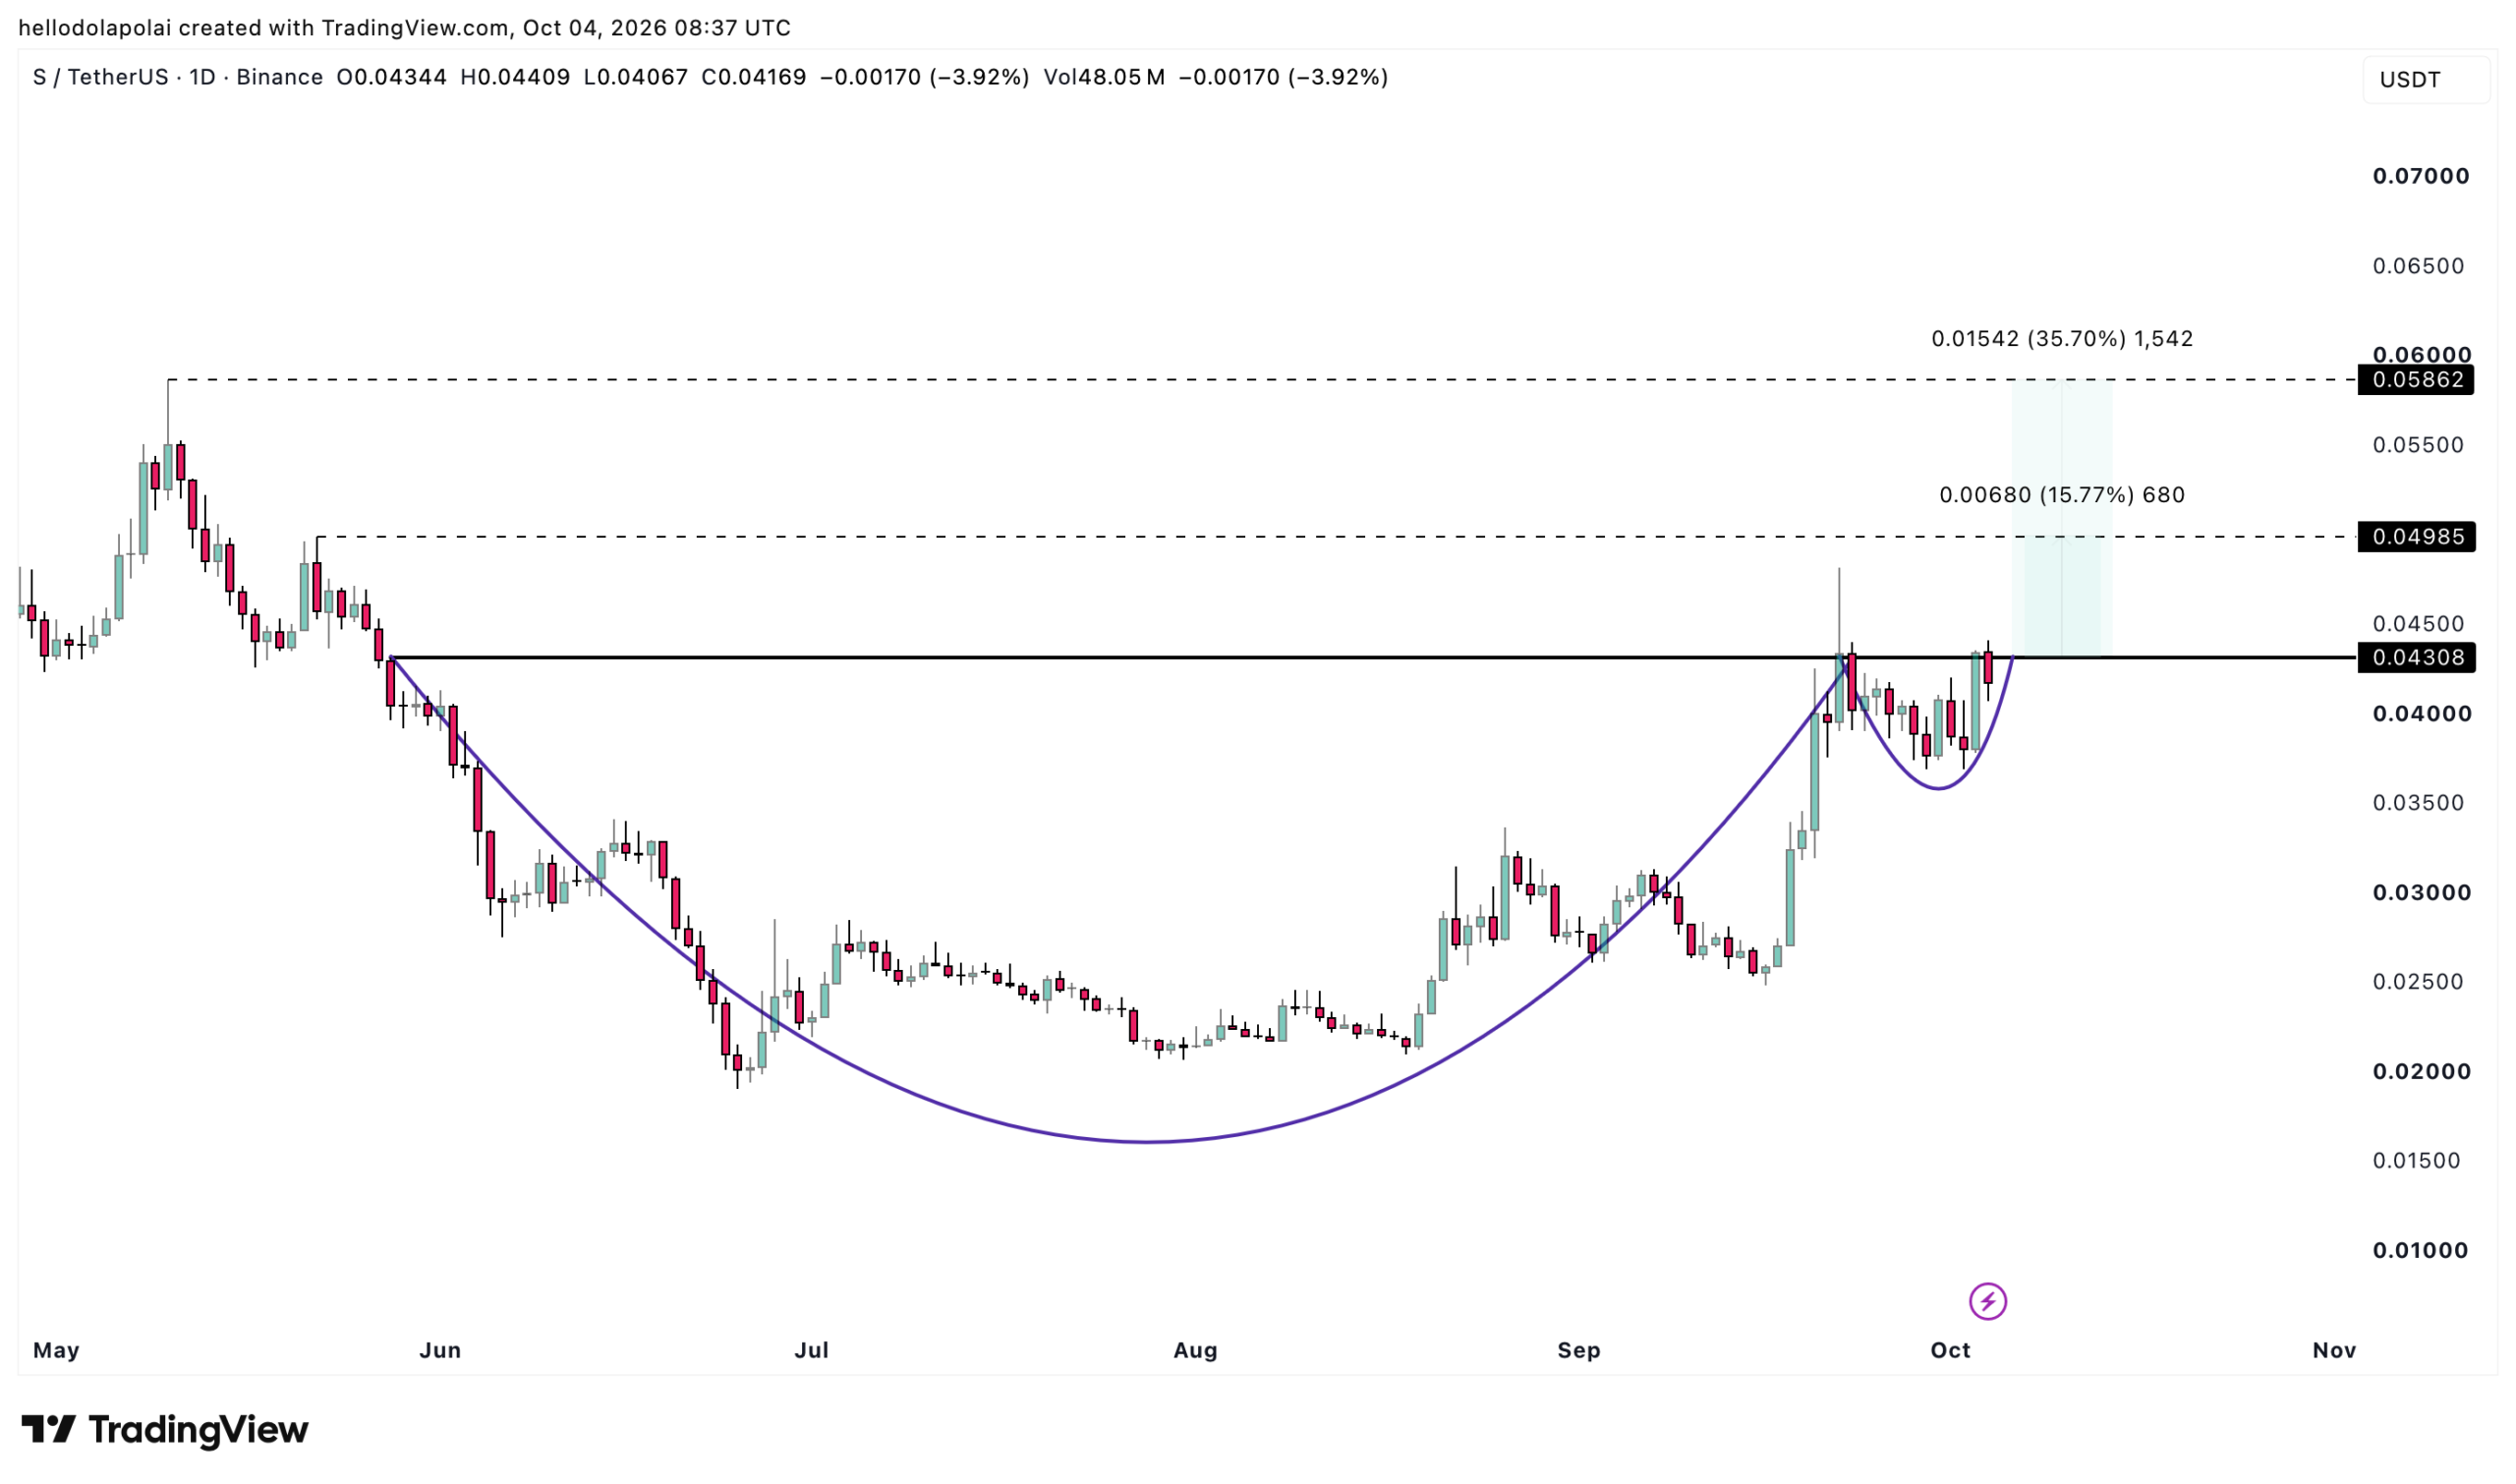
There are two levels of interest from this point onward. First is the closer target, which is $0.049 on the chart, 15% from the neckline, while the deeper stretch would see price rally 35% to $0.0586.
Price must break above the neckline to establish the bullish run. If sellers reject the price at this level, the asset could consolidate around the neckline and form a broader handle pattern or decline and invalidate the setup.
MACD and MFI reveal mixed signals
The rally remains broadly conditional based on indicator analysis using the Moving Average Convergence Divergence (MACD) and the Money Flow Index (MFI).
MACD carries more weight in the condition here, as the indicator is attempting to form a bullish pattern known as the “Golden Cross” when the blue MACD line crosses over the Orange Signal Line.
Currently, the blue line is slightly below the Orange Signal Line, with readings of 0.00304 compared to 0.00301. A flip above this could kickstart a much broader bullish trend.
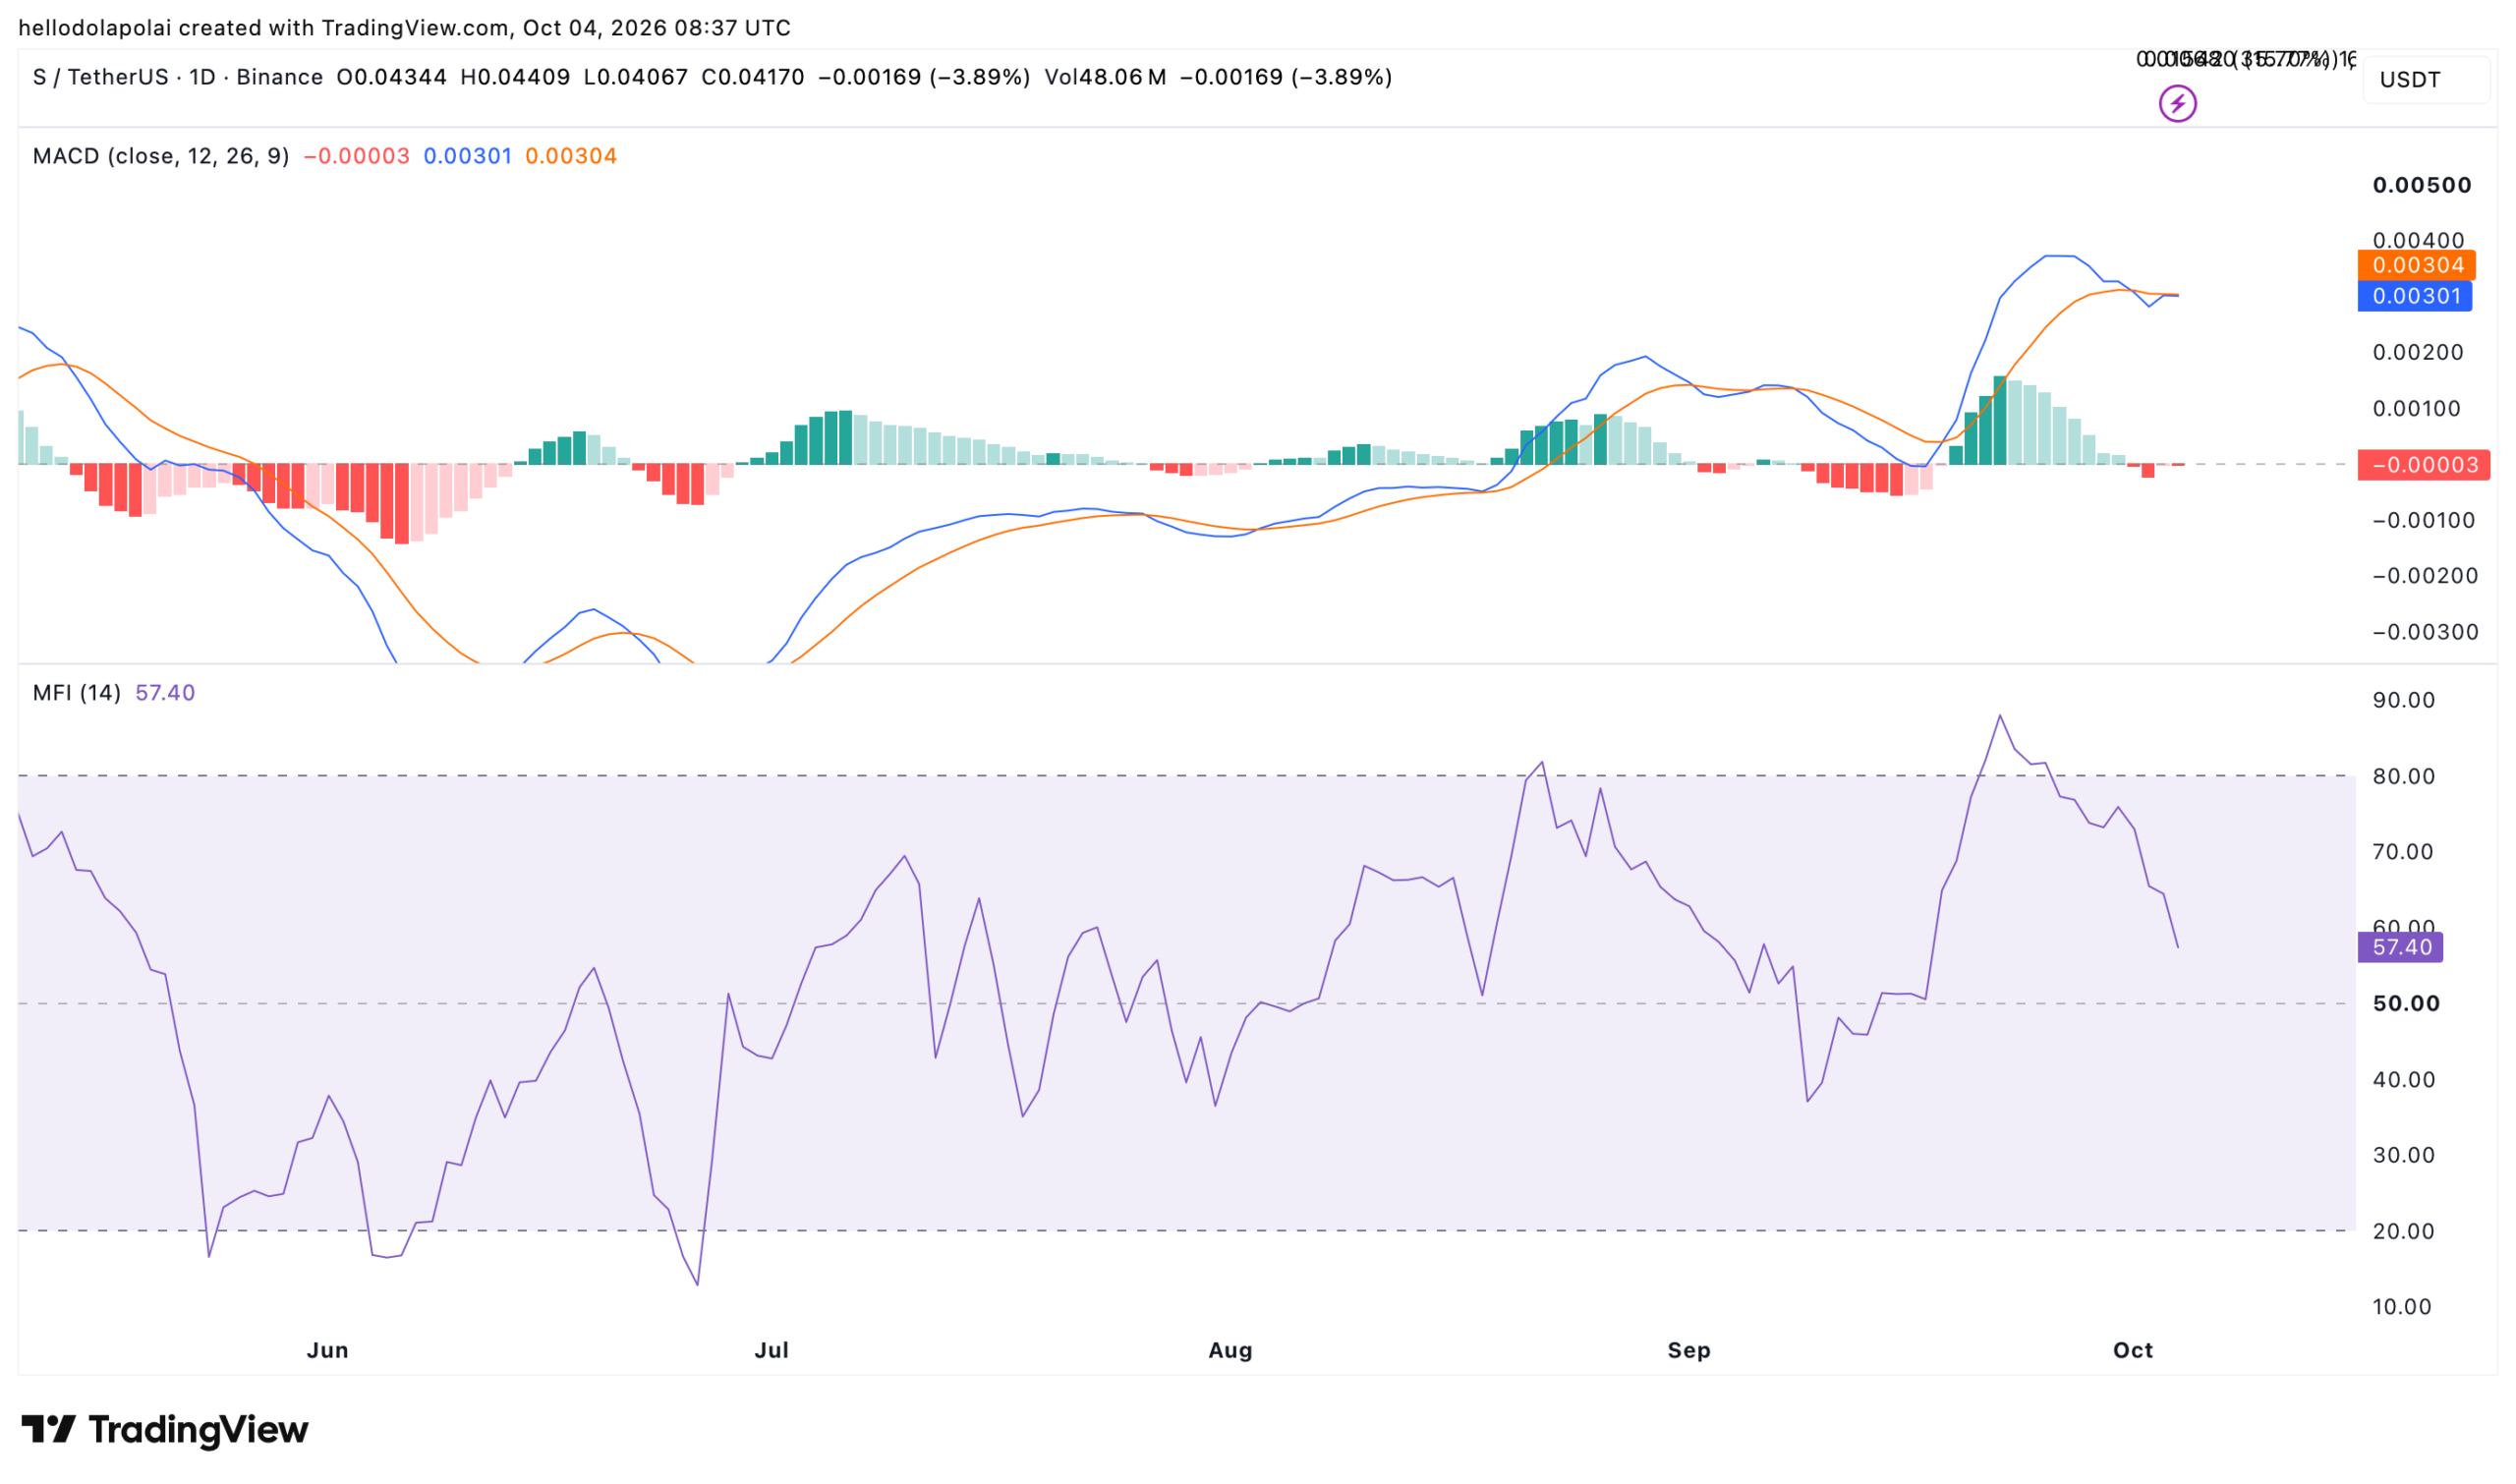
The MFI warns of a much broader risk of a potential decline in price based on the recent drop. The drop signals that there has been a massive outflow of capital for the past couple of days.
When capital exits the market at this pace, investors may be taking profits or turning bearish. The former seems to be the case as the MFI remains in the positive zone, anywhere between 50 and 80. At the moment, the MFI has a reading of 57.4.
The rally may not materialize in the near term unless the MFI turns higher and the MACD forms a golden cross pattern.
Long volume supports Sonic’s bullish outlook
The Long/Short Ratio on the chart, which records market volume and sees whether long or short volume takes the upper hand, indicates there is a bullish outlook.
According to the chart, long volume accounts for 53% of Sonic’s perpetual market, compared with 47% for short volume. This means there has been more bullish activity in the market.
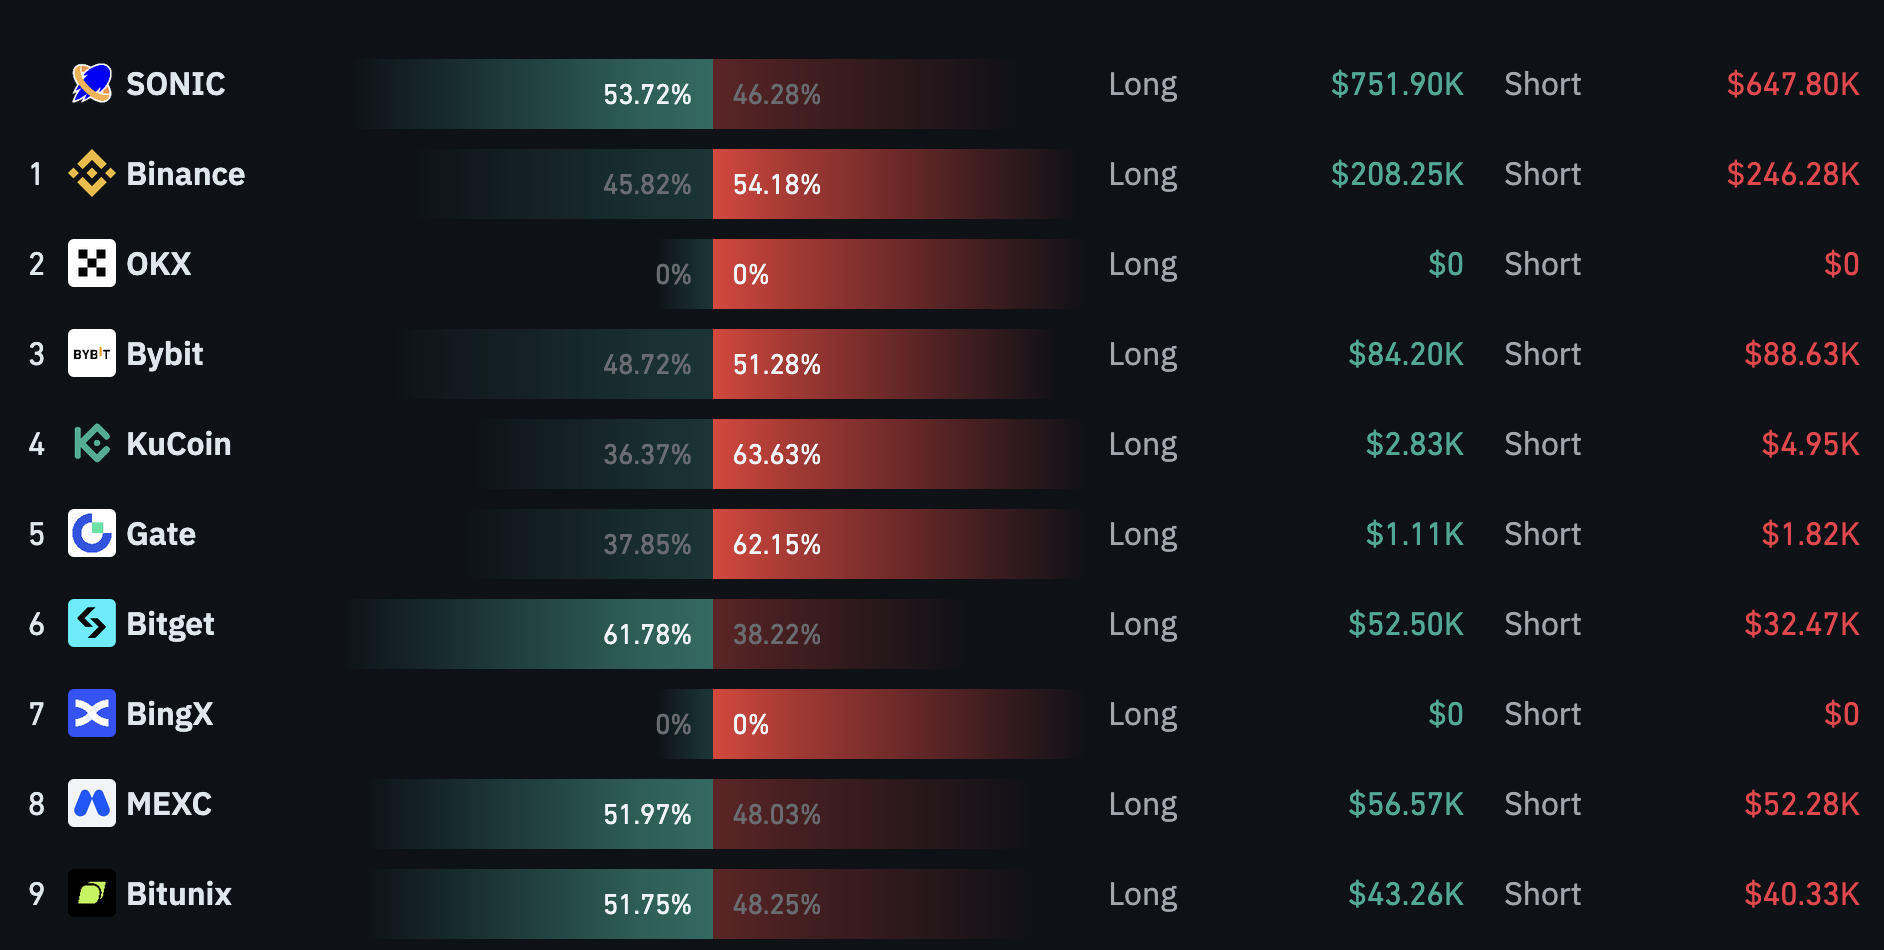
The volume has been long dominant across the top three crypto trading venues where buying activity occurs in the market. The sustained buy volume could impact price, pushing it higher in the near term and helping it overcome the neckline resistance.
Final Summary
- Sonic’s cup and handle pattern points to a potential breakout toward $0.049 and $0.0586.
- MACD and MFI must strengthen to support the rally and confirm bullish momentum.