Stablecoin dominance supports mark Bitcoin price tops – Impact on BTC?
The SSR is a very important metric that can be used to assess what's next for Bitcoin

- Stablecoin liquidity has been declining to allude to BTC’s inability to sustain its upward momentum
- Stablecoin dominance supports have previously signaled Bitcoin’s price consolidation or corrections
Stablecoin liquidity has been declining over the past few weeks, despite a hike in minting and supply. In fact, just recently, Bitcoin saw its price plunge from its top in Q4 2024, with the crypto falling well below $80,000 too.
Now, it’s worth pointing out that at press time, Bitcoin had recovered to trade above $85,000 on the charts. What about the Stablecoin Supply Ratio (SSR) Oscillator though? Well, it assesses liquidity and BTC’s market buying behavior relative to stablecoins. What does the latest SSR reading suggest?
A look into the Stablecoin Supply Ratio – Market liquidity & Bollinger Bands
The SSR metric establishes Bitcoin’s market capitalization relative to the individual stablecoins or the combined stablecoin market. A low SSR means that stablecoins have higher purchasing power and increased liquidity that could flow into BTC. As of February, the SSR oscillator had surged and stood at around 14.
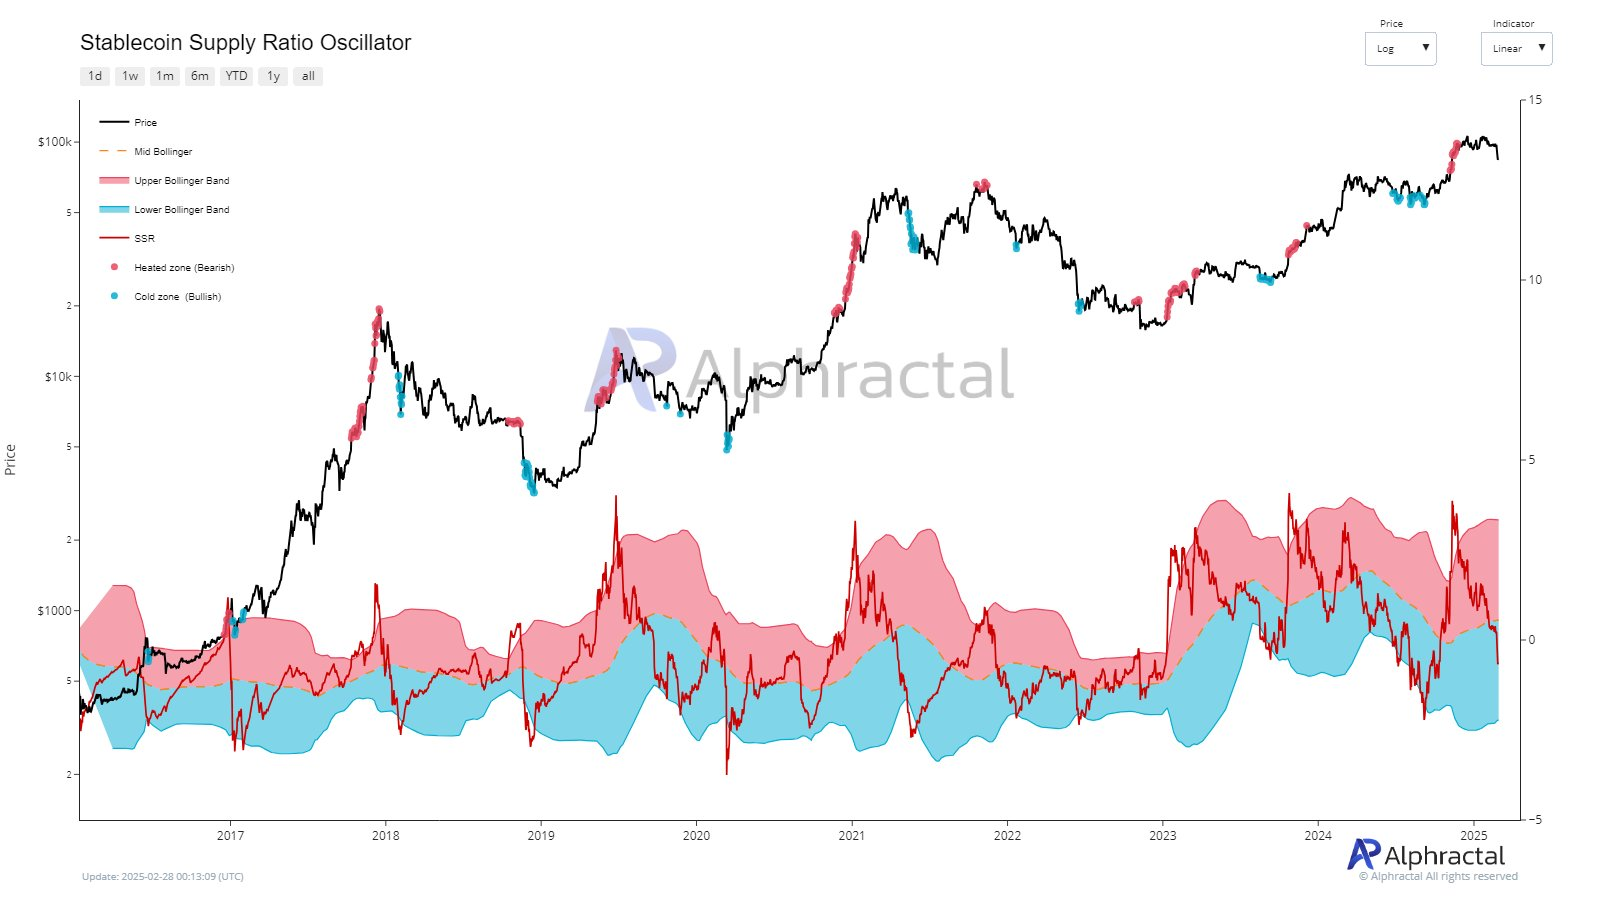
Potential trend reversals and market volatility insights can be evaluated using the Bollinger Bands surrounding the SSR. The SSR approaching the upper band hinted that stablecoins’ liquidity has been declining, relative to BTC’s market cap.
Stablecoin dominance vs Bitcoin – Historical correlation
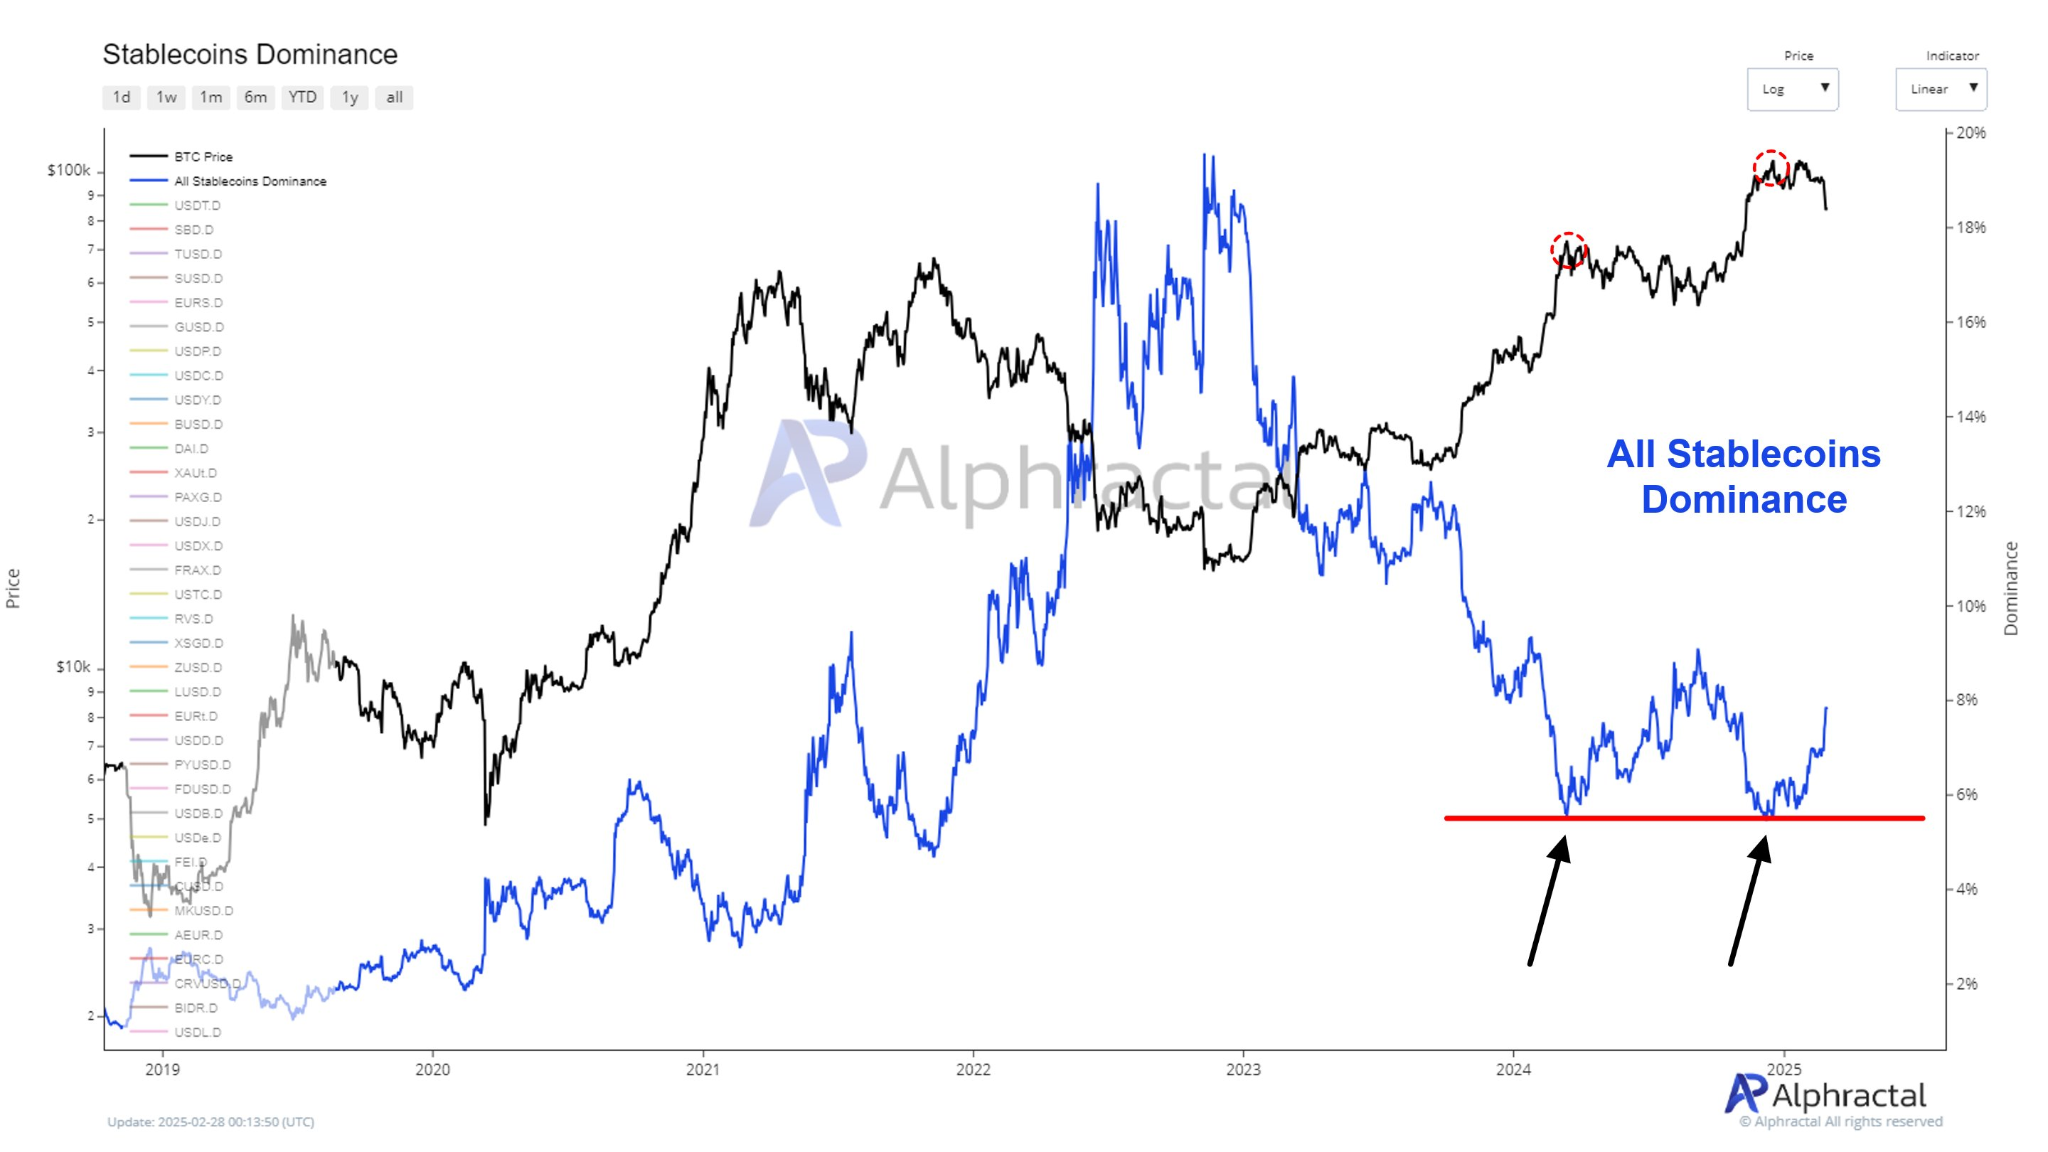
Looking at previous SSR key supports, a rising SSR has often preceded BTC’s price corrections. In late 2024, Bitcoin’s peak aligned with a low stablecoin dominance and a subsequent trend reversal as the SSR rose.
Conversely, in cases where the SSR dropped towards the lower Bollinger Band, the market saw greater stablecoin liquidity, leading to Bitcoin’s bullish momentum. According to Alphractal’s analysis on X (formerly Twitter), this historical relationship could be held in the current market volatility.
Market analysis and trends
Over the previous week, the crypto market has seen increased volatility as BTC fell below the $80,000 key level. Factors such as the recent Bybit Exchange hack and prevailing Trump tariffs have led to global economic uncertainties and greater market volatility.
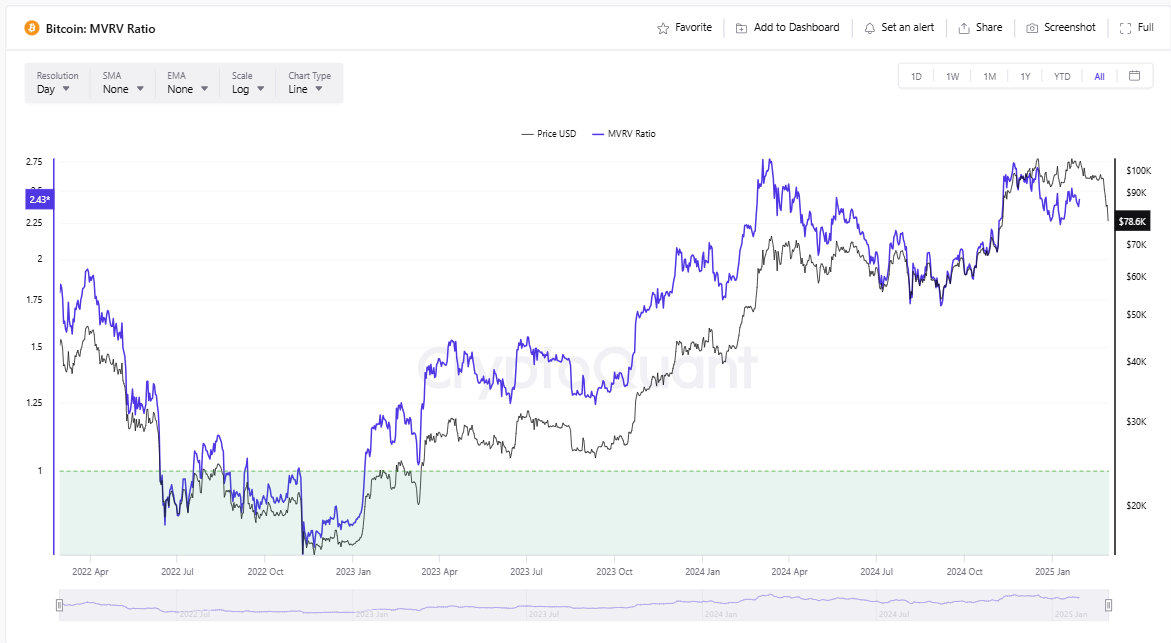
With the SSR bouncing off a key support level, Bitcoin’s next price movement remains undetermined. At the time of writing, BTC’s MVRV ratio was 2.43 – A sign that it was neither extremely overvalued or overbought.
Bitcoin at crossroads – What next?
If the SSR ratio maintains an uptrend amid market volatility, BTC could face further downsides. However, greater stablecoin liquidity leading to a decreased SSR could boost Bitcoin’s resurgence and bullish momentum in the next few weeks.