


- There was a marked rise in buying pressure in March despite Bitcoin’s dip.
- The Tether Dominance chart showed some volatility could be around the corner.
Bitcoin [BTC] rebounded above the $70k level after a pullback to $60.7k a week earlier. Some of its metrics highlighted bearishness even though prices climbed higher.
For example, some long-term holders were booking profits on Bitcoin [BTC], indicating a lack of conviction.
To understand where BTC and the rest of the market were headed next, AMBCrypto looked at stablecoin metrics from CryptoQuant. It showed buying power was rising, which could see the rally continue.
Assessing stablecoins netflow from exchanges
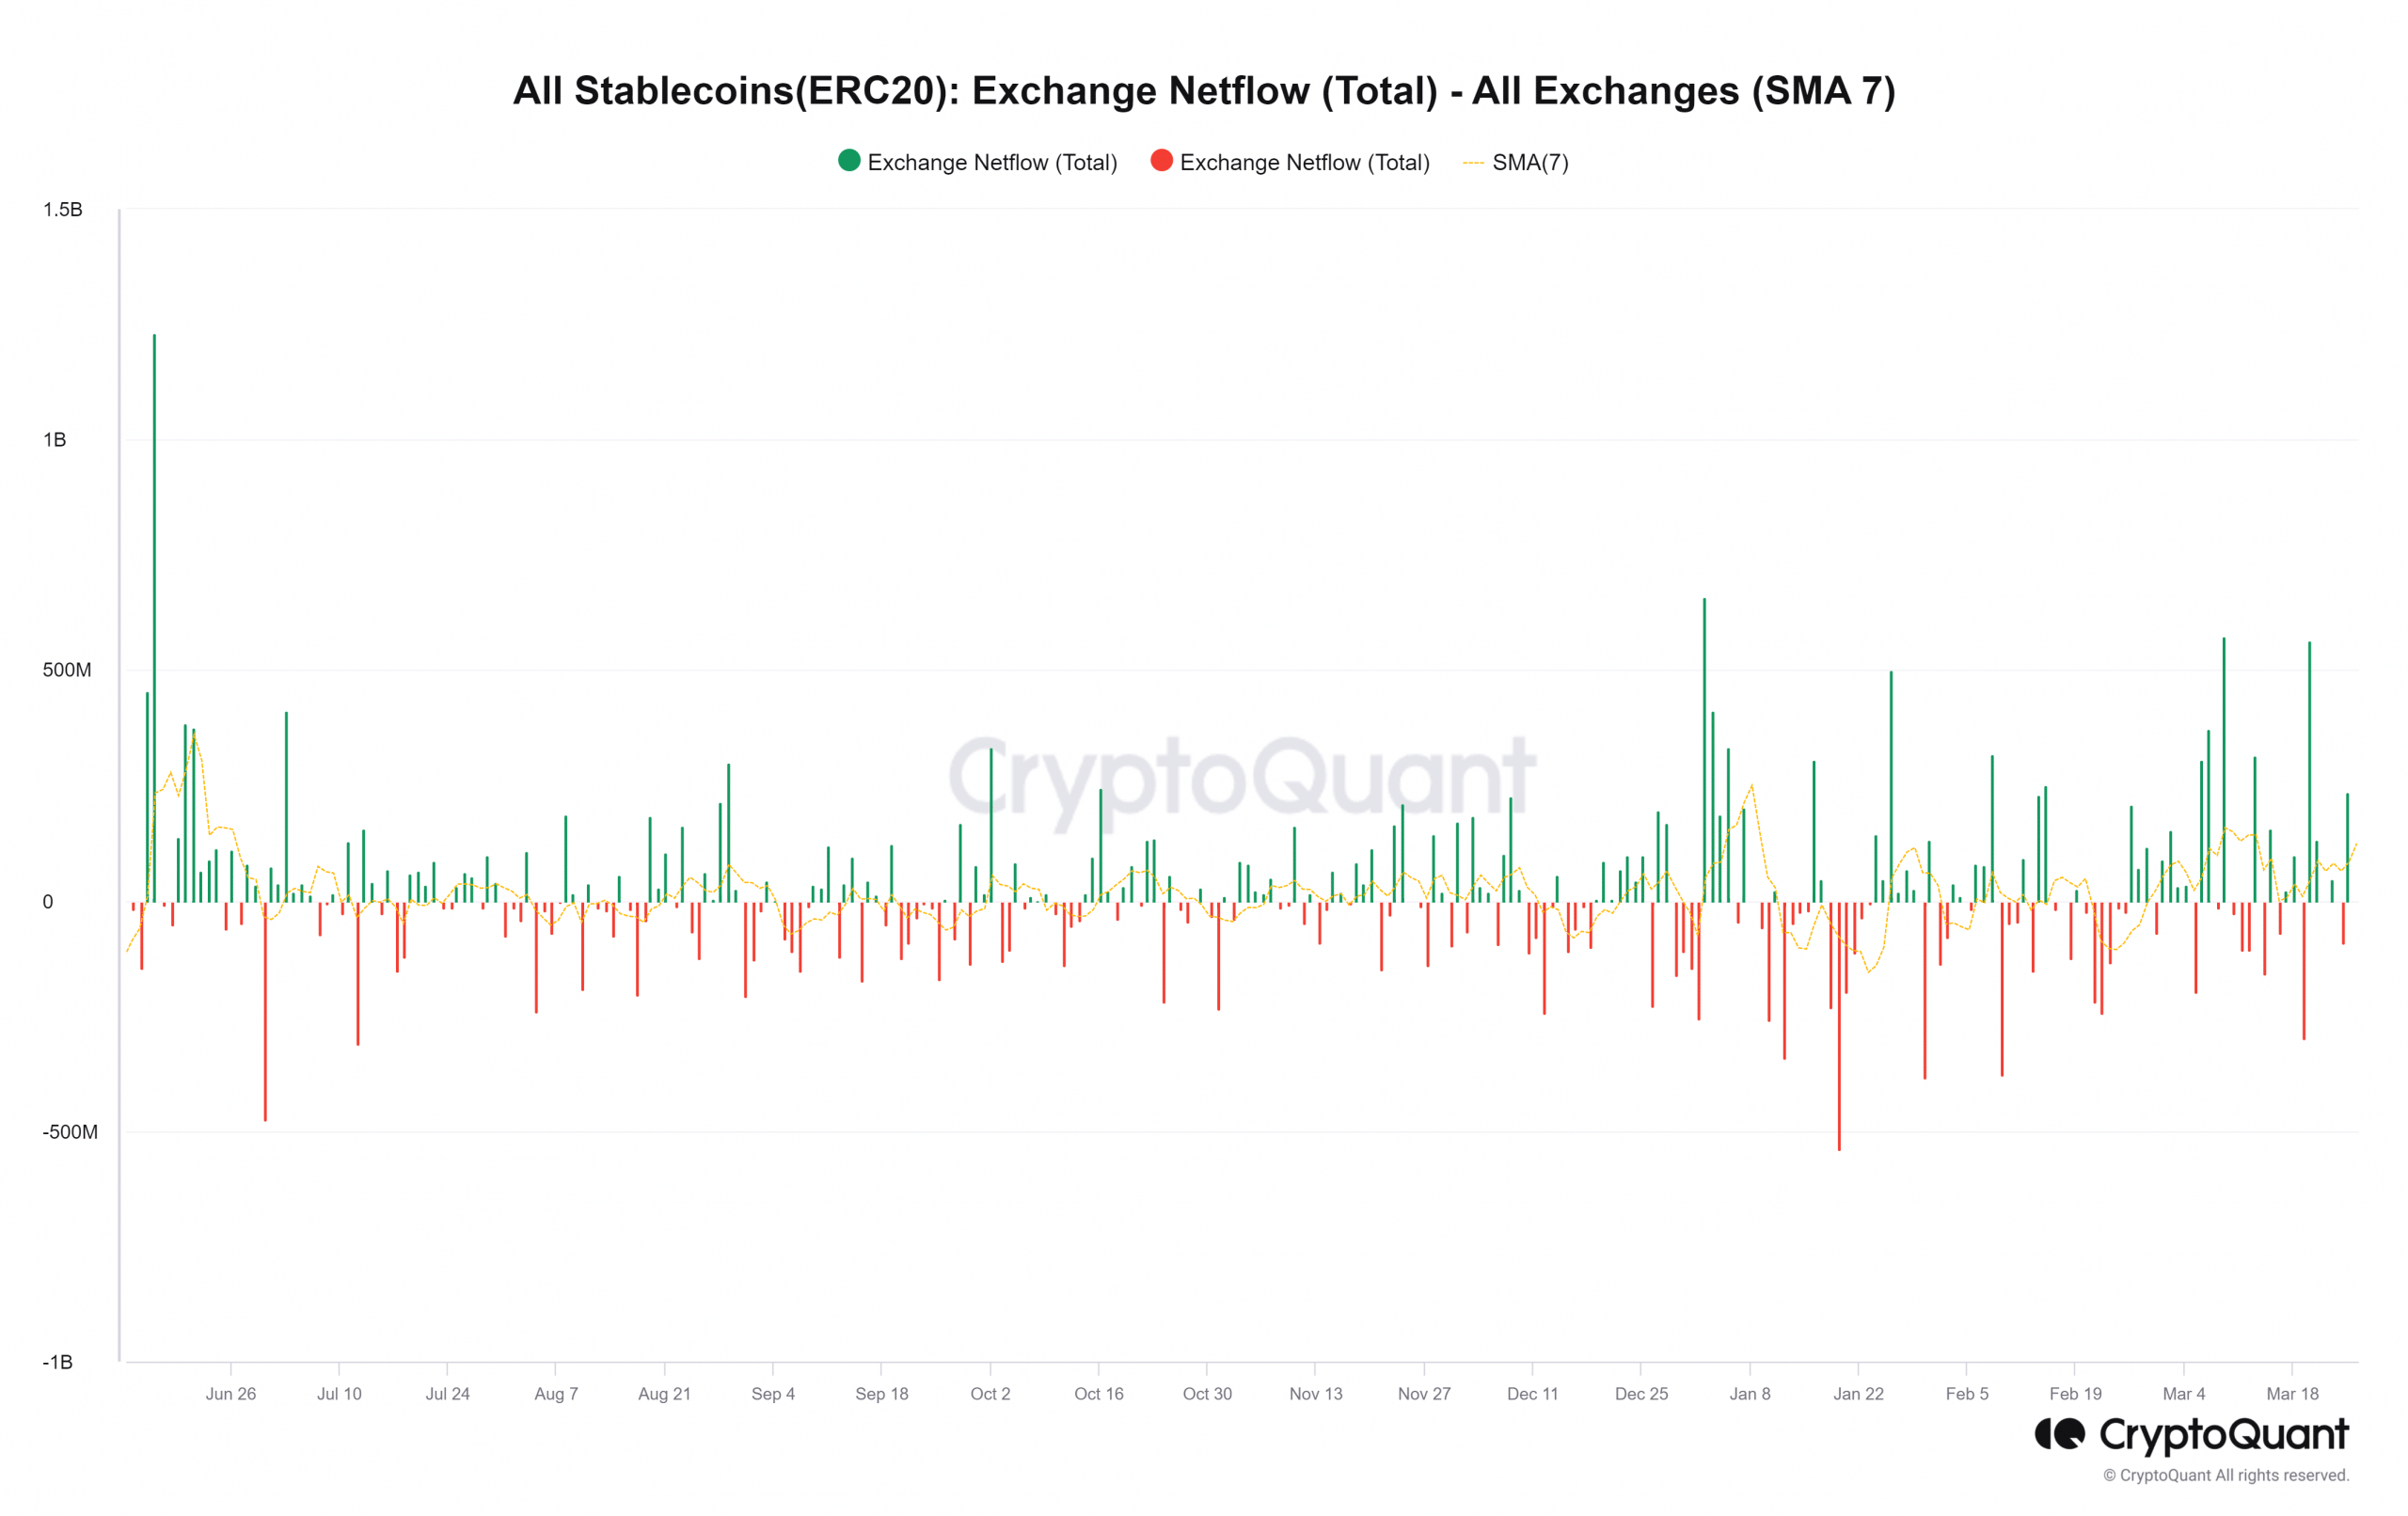
The stablecoin netflow to exchanges noted a positive trend in March. Per the 7-day simple moving average, there was an increased inflow of stablecoins into exchanges in the past ten days.
This could lead to buying pressure, a bullish sign overall. Combined with BTC’s recent losses, it showed that investors were sending stables to exchanges to buy the dip.
It could also serve as collateral in derivatives trading, which could put pressure on prices to climb higher, but add to the risk of volatility.
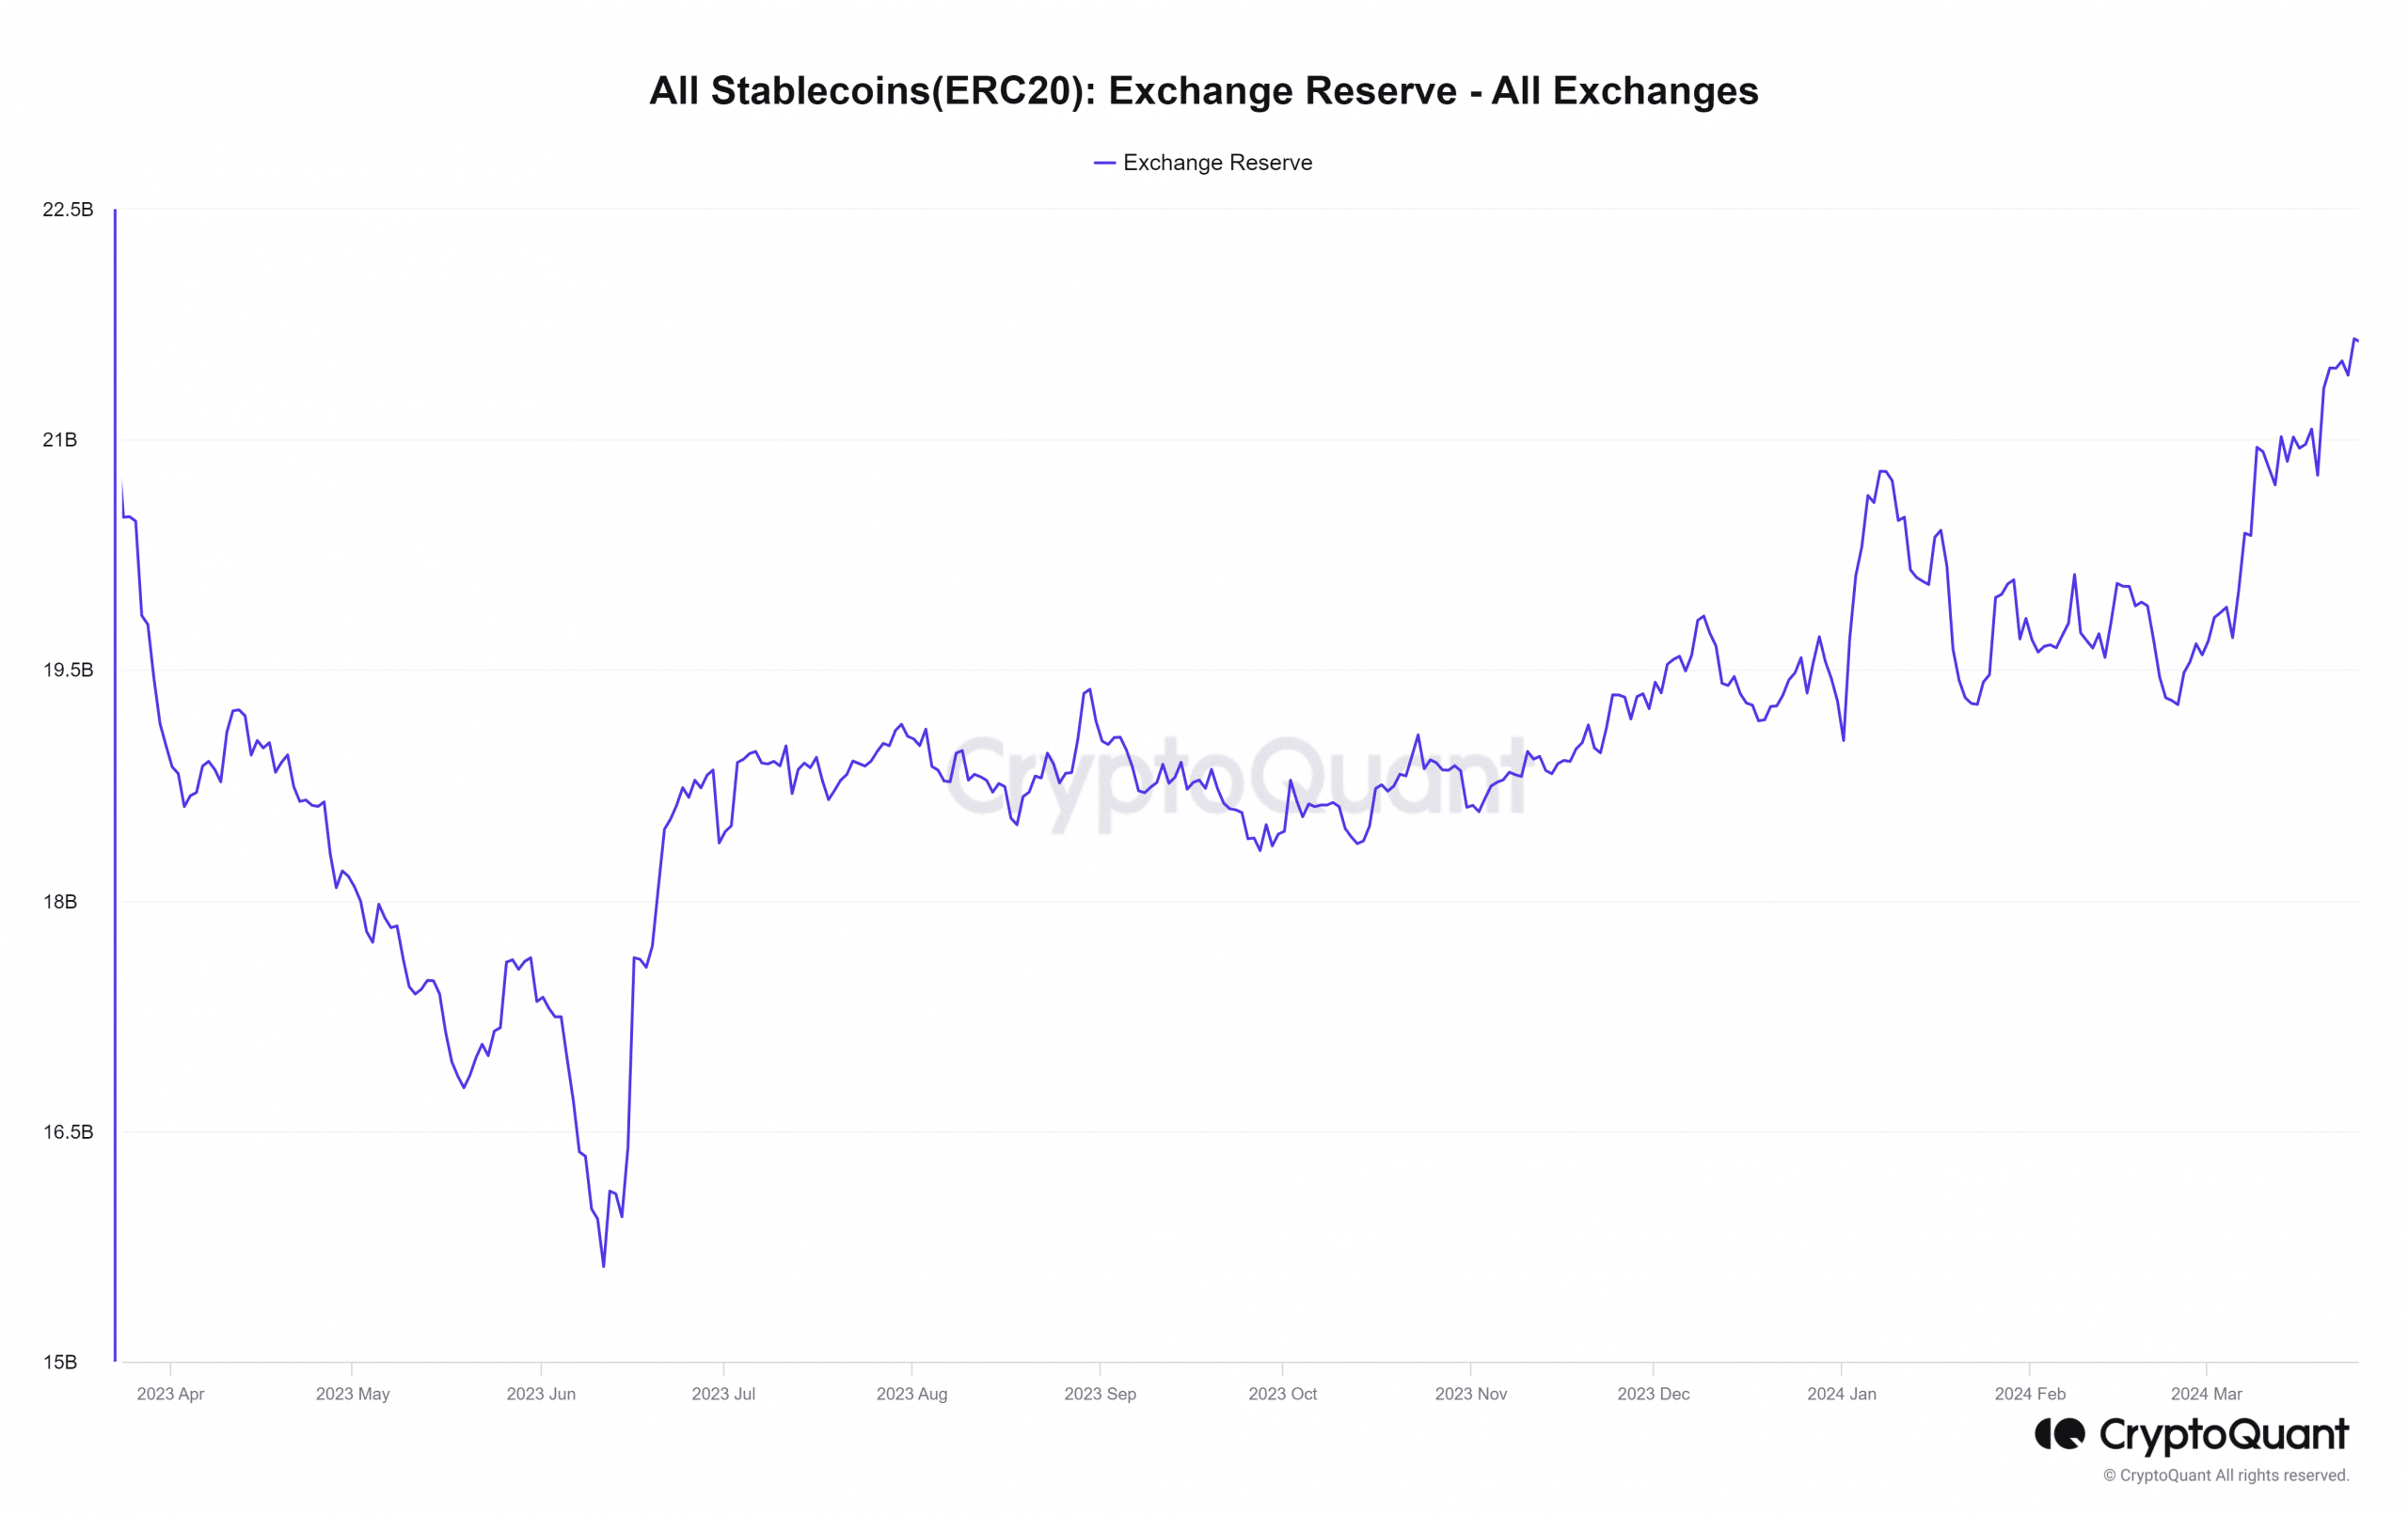
The stablecoin exchange reserve was also trending higher over the past month. Usually when a crypto’s exchange reserve rises, it indicates potential selling pressure.
For a stablecoin like Tether [USDT], it is the opposite.
When the exchange reserve rises, it underlines an increase in buying pressure. Since the role of a stablecoin is vital in terms of providing liquidity, market participants prefer to stay in stables during times of volatility.
They can exchange this for assets like BTC during an uptrend or when sentiment is particularly bullish. Therefore, a rise in the stablecoin exchange reserve is another bullish factor.
The argument for a short-term bearish case
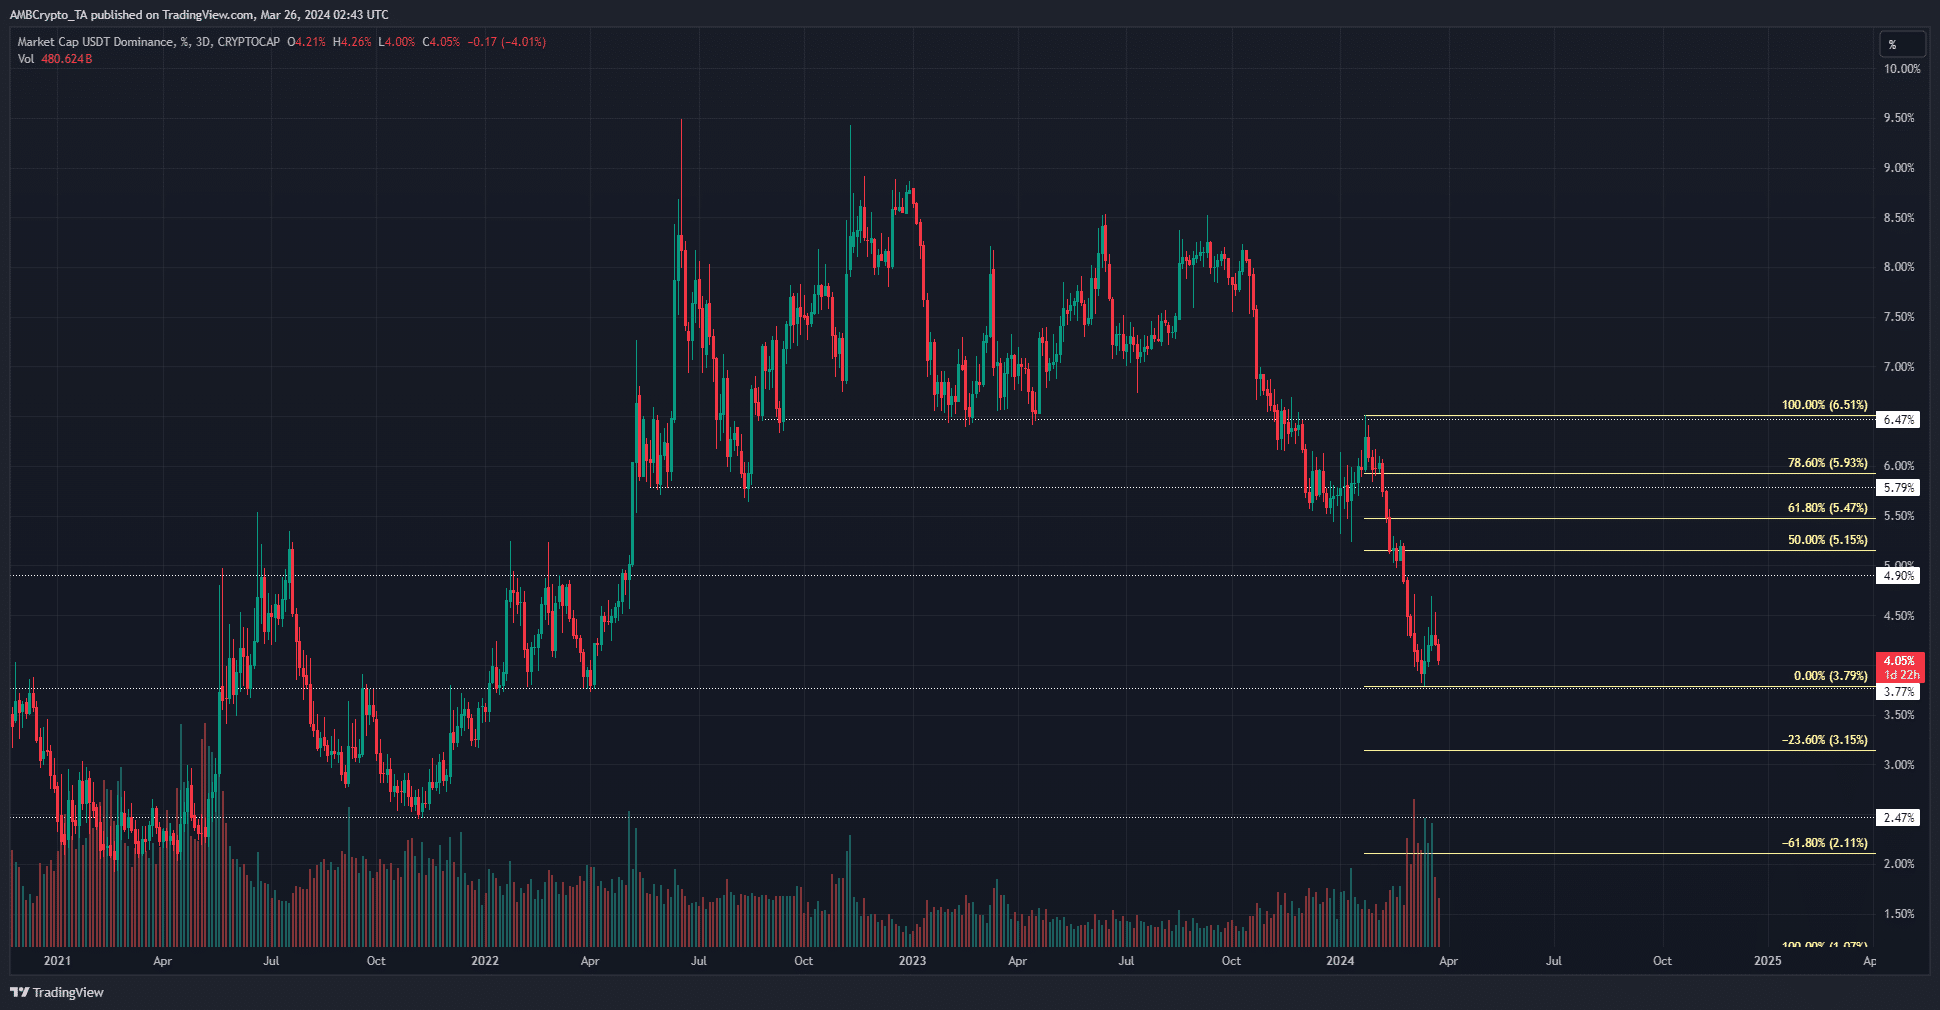
Like the price action of Bitcoin, the movement of the USDT dominance could also yield significant insights into the trend of the market. USDT was chosen since it is the largest stablecoin in circulation.
Since mid-October, the USDT.D chart has trended downward. A set of Fibonacci retracement levels was plotted for the dominance’s most recent move downward.
It showed that a retracement could commence in the coming weeks. A bounce in the dominance of USDT would reflect bearish pressure across the crypto market.
Is your portfolio green? Check the Bitcoin Profit Calculator
Participants selling their tokens for USDT would cause the dominance to bounce- and technical analysis showed we could see USDT.D reach 5.15% or 5.47% in April.
Investors would want to have dry powder ready for use should prices crash. The higher timeframe trend of BTC was strongly bullish- and short-term discounts would be extremely welcome.