- The longer-term structure was bearish and $2 is a key psychological resistance.
- Traders should be prepared for a price move below a short-term support level due to the liquidation levels there.
Stacks [STX] prices bounced by 25.8% in the past three days. It has increased by 13.25% over the past 24 hours, while Bitcoin [BTC] dropped by 1.75% during the same period. BTC also saw volatility increase in the early hours of Thursday.
Its price jumped from $57k to $58.3k before retracing the entire bounce, then jumped to $58k again. STX bulls were able to capitalize on the short-term upward momentum swing for Stacks, but can they break the higher timeframe trend?
The $1.8 is the next target but traders must temper their enthusiasm
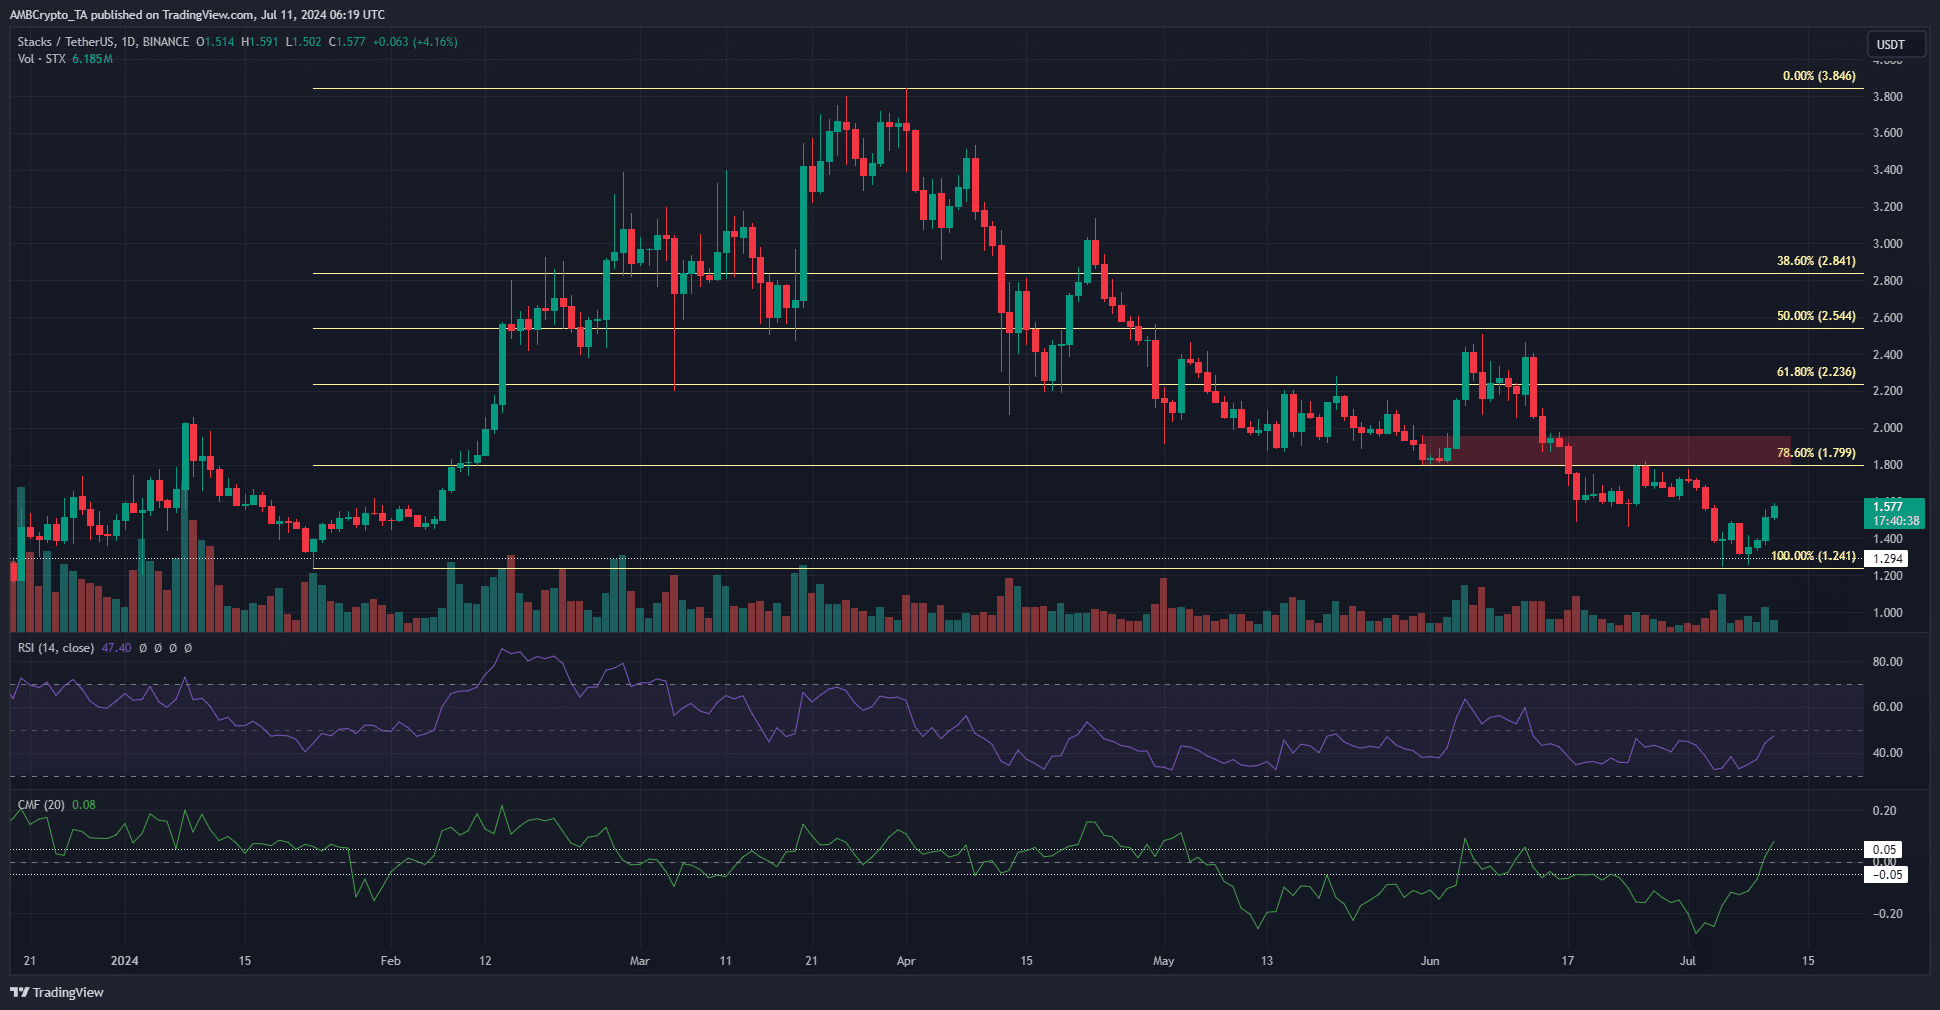
Source: STX/USDT on TradingView
The lower timeframes were encouraging for the bulls. A level of support from early 2024 at $1.3 was retested and defended, which saw the price climb. The lower timeframe resistance at $1.5 was also beaten.
The CMF on the daily chart has poked its head above +0.05 to signal strong capital flow into the market. The RSI was at 47 and still bearish, but a move past 50 is anticipated and could be an early sign of a trend change.
Hence, bulls can expect a move to $1.8 commence from here on. However, the higher timeframe market structure such as the daily was still bearish. The $1.8-$2 is a supply zone that is teeming with sellers.
Should traders expect high volatility from STX soon?
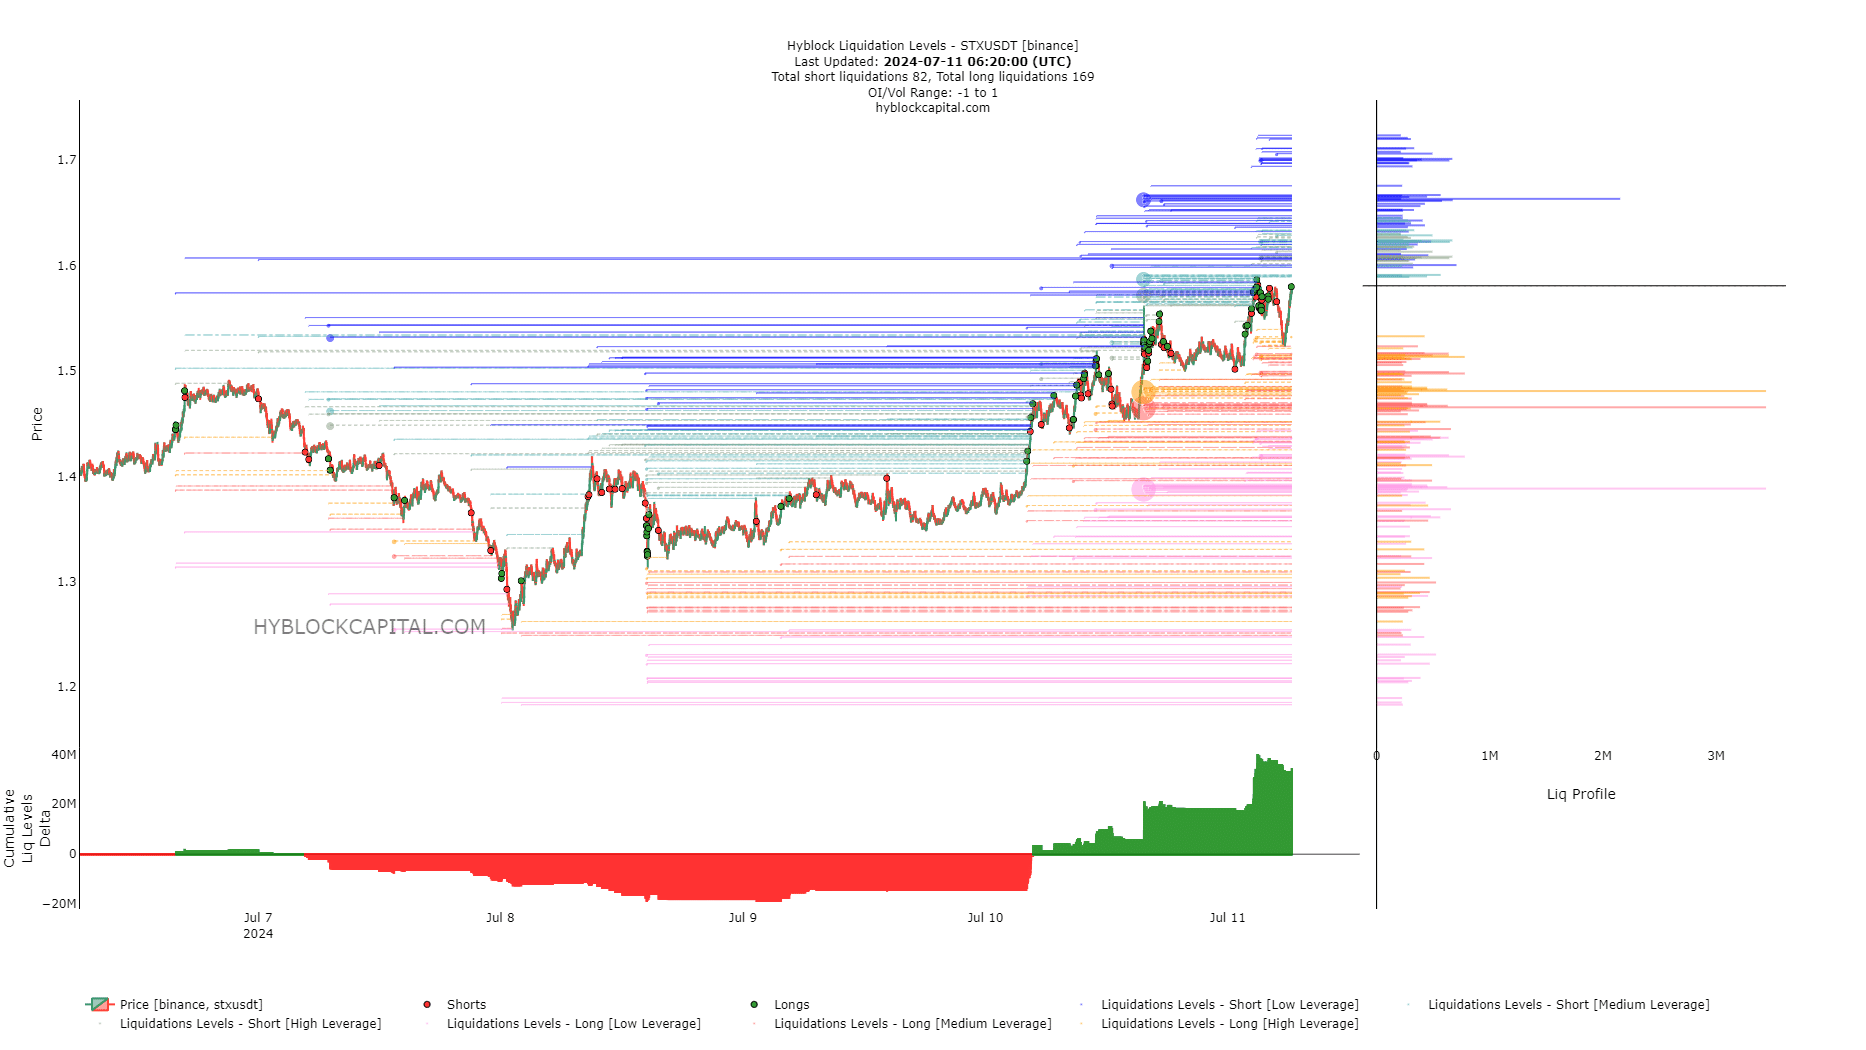
Source: Hyblock
The move above $1.5 on the 10th of July whipped up the bulls, but it might set up the conditions for a southward liquidity hunt. The cumulative liq levels delta was keenly positive, which meant long liquidations outnumbered the shorts.
This could see prices squeezed downward to force long liquidations.
Realistic or not, here’s STX’s market cap in BTC’s terms
There were two clusters of medium and high leverage at $1.46 and $1.48.
The $1.51 is now a support level, but due to the liquidity just below it, prices might deviate toward $1.45 before moving to $1.8-$2 resistance in the coming days.
Disclaimer: The information presented does not constitute financial, investment, trading, or other types of advice and is solely the writer’s opinion.