Stacks (STX) – Here’s where you can find the next buy opportunity after 26% fall

- Stacks tested the $1.75 support amid a 26% weekly drop
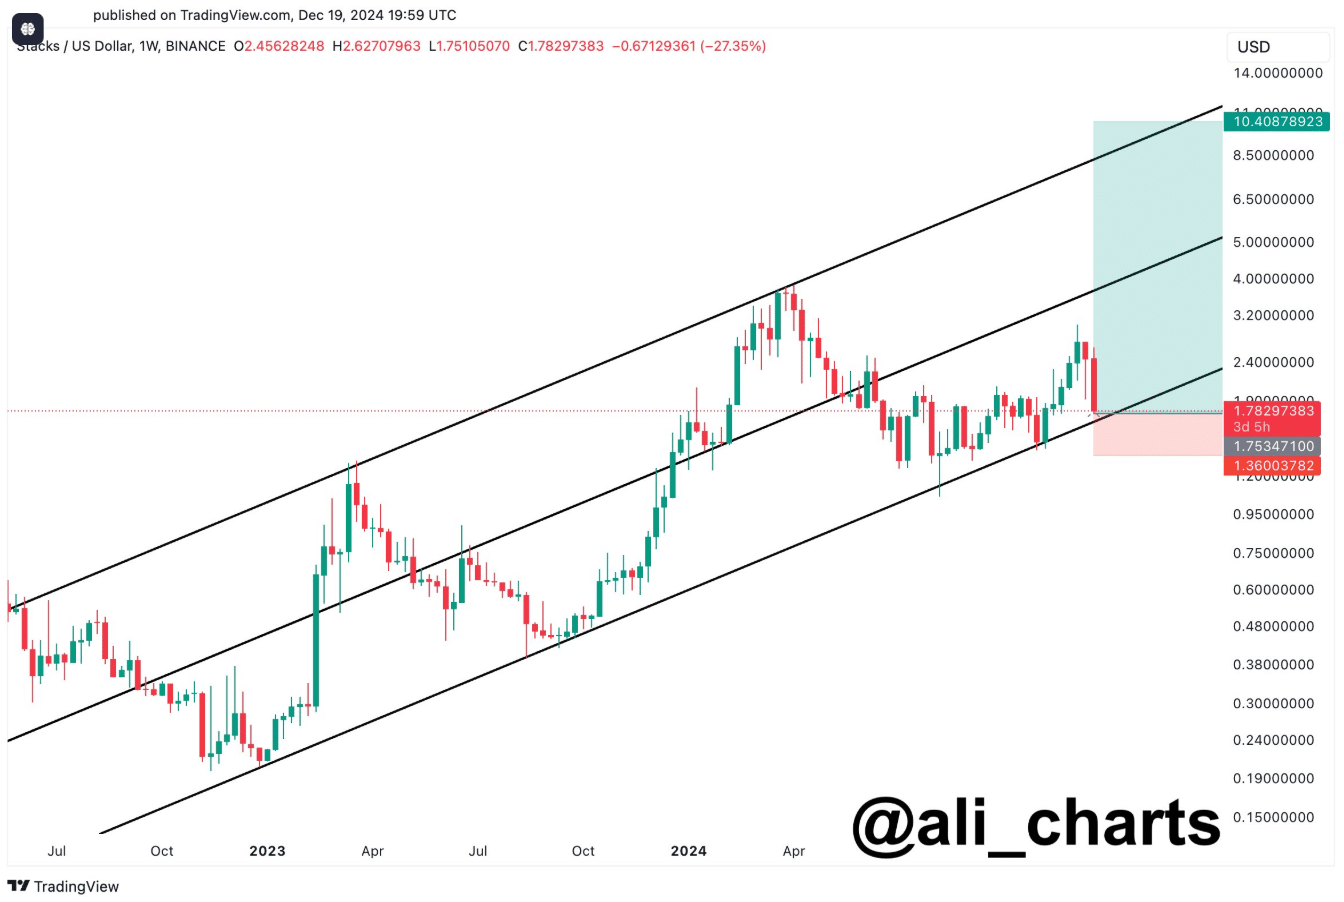
- Ascending channel pointed to bullish potential, with the resistance at $2.40 and target at $10
Stacks (STX) was trading at $1.71, at the time of writing, following a 11.73% decline over the last 24 hours and a 26.06% drop in just 7 days. With a circulating supply of 1.5 billion STX, the cryptocurrency had a market capitalization of $2.57 billion.
Trading volume in the last 24 hours stood at $439 million, indicating substantial activity during this price drop.
The recent downturn in STX‘s price seemed to be in line with a broader market decline. This downturn pushed the token towards its critical support level within a long-term ascending channel.
Ascending channel indicates long-term bullish trend
According to AMBCrypto’s analysis, Stacks seemed to be trading within a defined ascending channel – A sign of a broader bullish trend despite recent declines. At press time, the price was approaching the lower boundary of this channel, between $1.70 and $1.80 – A zone that has consistently acted as strong support.
The upper boundary of the channel pointed to a potential target near $10, suggesting room for future price recovery if the support holds.
In fact, popular analyst Ali Martinez described this phase as a possible buying opportunity, emphasizing the importance of the levels for long-term investors.
Recent correction and key levels
Stacks pulled back sharply from its mid-channel resistance near $4.50, falling by 27.35% during this correction. While this decline has pushed the price towards its support, such pullbacks are common in long-term uptrends and may provide accumulation opportunities.
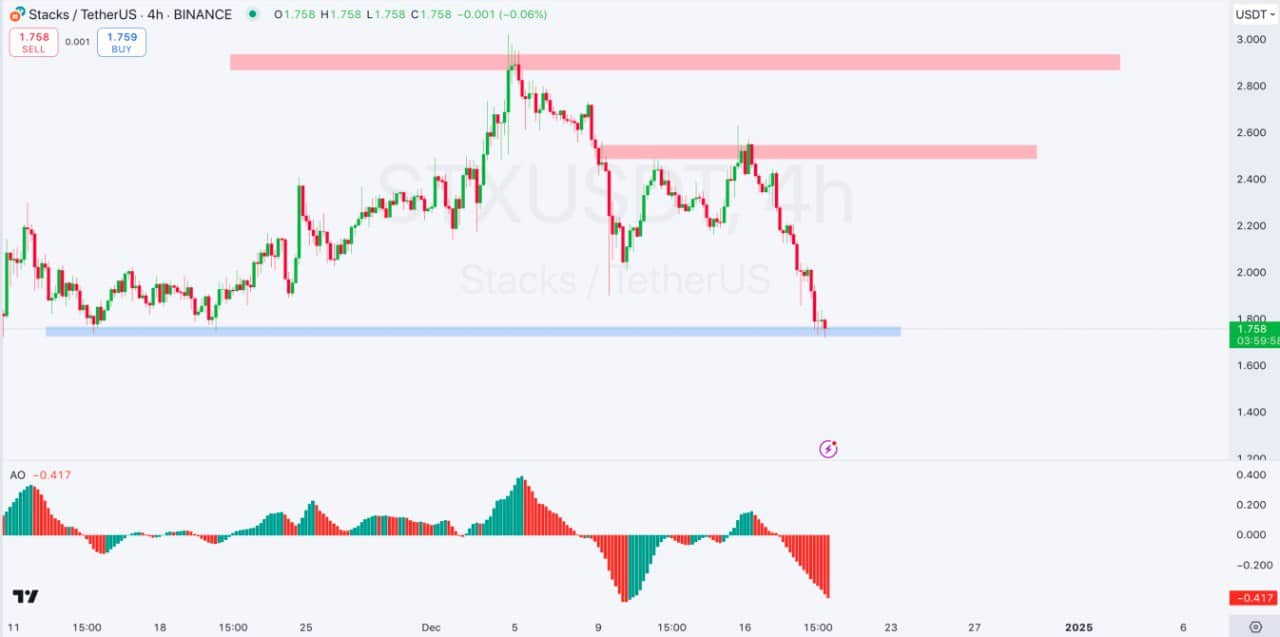
The support at $1.75 – $1.78 will be critical in determining the next move for STX. If this level holds, it could lead to a rebound, with initial resistance targets at $2.40 – $2.50 and stronger resistance near $2.80 – $3.00.
However, a breakdown below $1.75 could trigger further declines, with the next major support levels at $1.50 and $1.40.
Momentum indicators signal mixed trends
The Awesome Oscillator (AO), at press time, displayed red bars – A sign of bearish momentum. However, a declining histogram indicated that selling pressure may be easing. For a bullish reversal, green bars on the AO would be needed, along with a breakout above lower-high resistance levels.
Traders should closely monitor the $1.75 zone for signs of a rebound or further breakdown. A sustained move above this level could push the price towards the $2.00 – $2.40 range in the near term.
Outlook and key metrics to watch
With STX trading near its support, investors are watching key levels to determine the next trend. The immediate support stands at $1.75, with major resistance zones at $2.40 and $2.80. If the lower boundary of the ascending channel is breached, downside targets of $1.50 or lower may come into play.
This correction, while steep, fits within a larger pattern of growth for Stacks, suggesting potential for recovery if support levels hold.


