
Disclaimer: The information presented does not constitute financial, investment, trading, or other types of advice and is solely the writer’s opinion
- XLM chalked a bullish pendant.
- Aggregated CVD spot flattened – indicating neither buyers nor sellers had leverage at press time.
Stellar [XLM] has retraced to a confluence area of support levels, which may impact traders if a trend reversal occurs. At press time, XLM traded at $0.1032, down only 0.71% in the past 24 hours, according to Coinmarketcap.
Read Stellar [XLM] Price Prediction 2023-24
On 31 March, XLM breached $0.1, appreciating by over 20%. But the bearish order block placed at $0.1124 set it into a correction, shedding about 8% in the drop. Will the confluence of support prevent further drop?
Can the $0.1020 support hold?
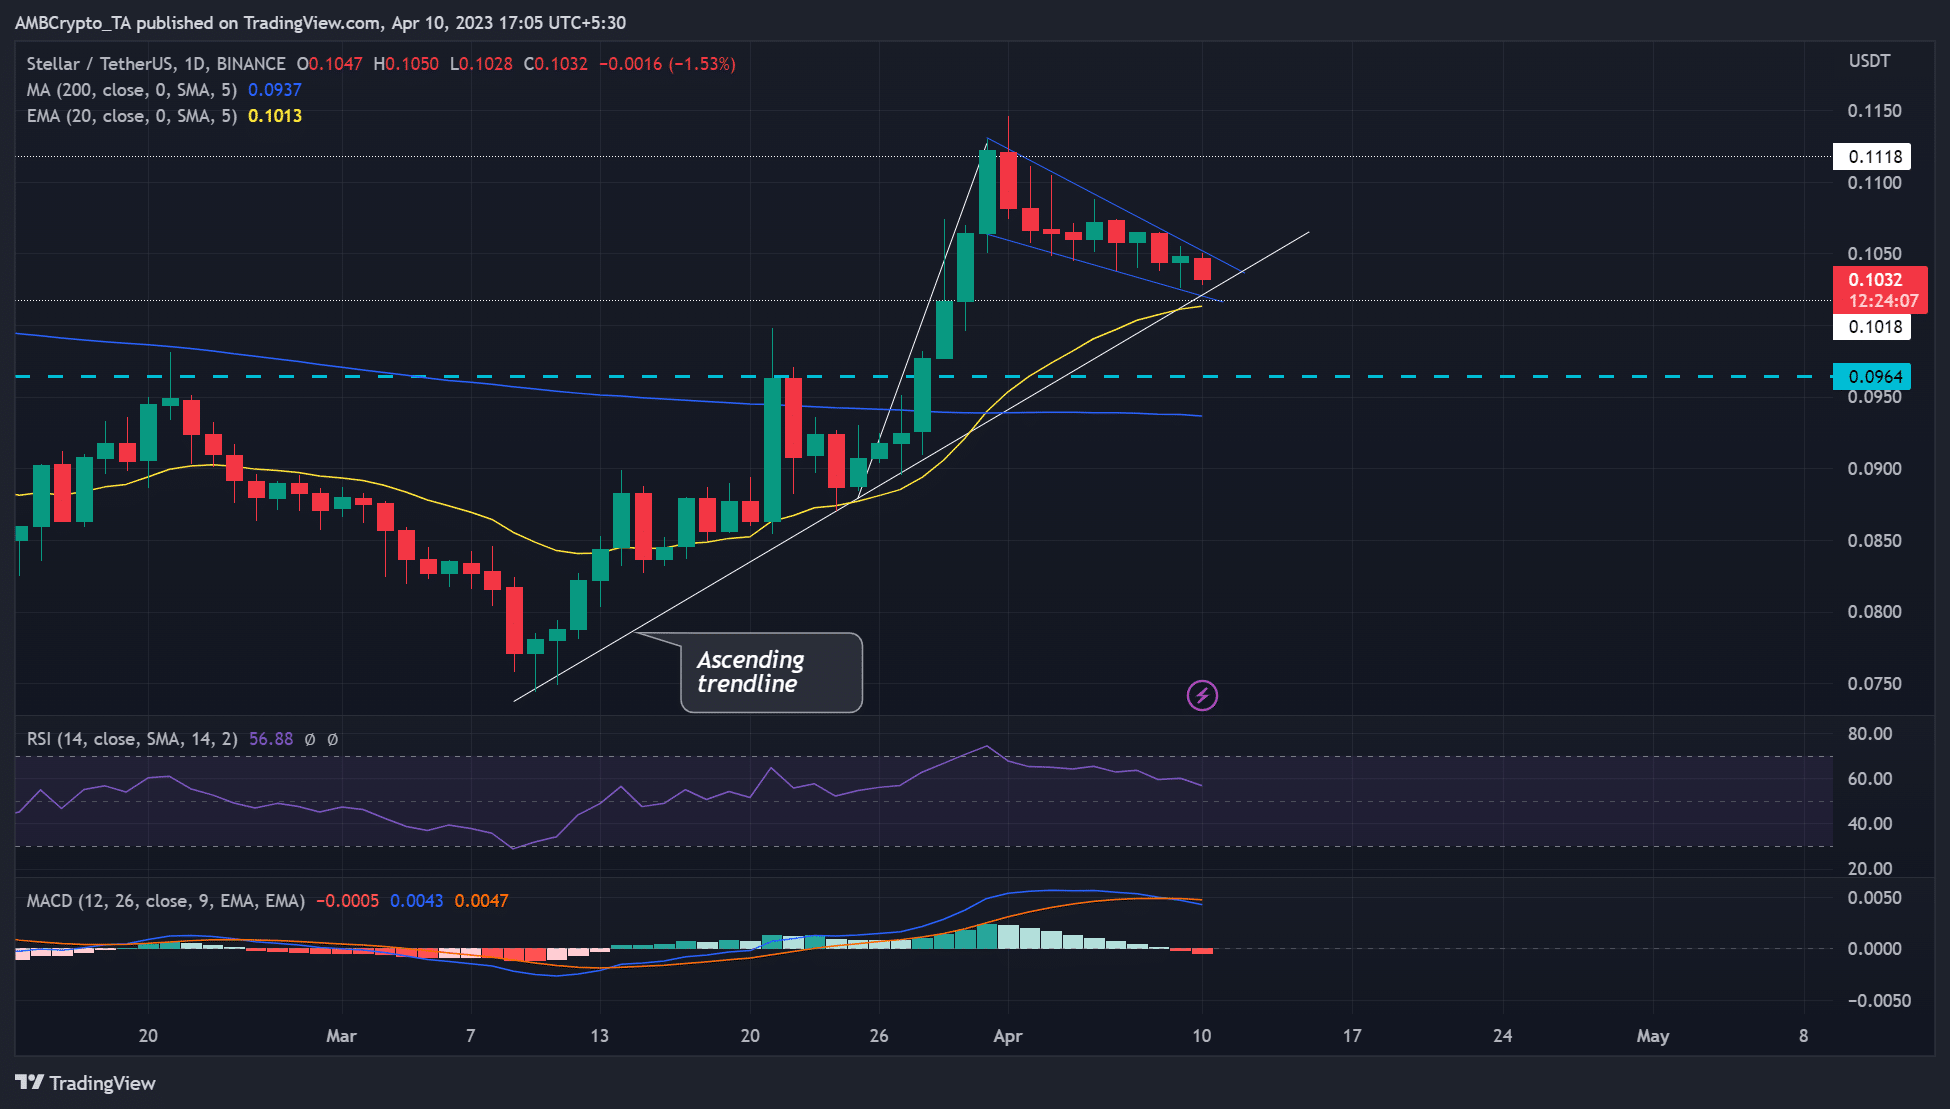
Source: XLM/USDT on TradingView
On March 28, XLM breached a stiff resistance level of $0.0964 and inflicted a bearish order breaker. But the upswing hit a price ceiling at $0.1118, with the overall price action chalking a bullish pendant.
Besides, the retracement has hit a key confluence area of $0.1020 – a convergence of an ascending line, a bullish order block on the 12-hour chart, and 20 EMA (exponential moving average). Sellers could face a strong obstacle at the confluence area which may offer bulls a soft landing to inflict a recovery. The immediate target for a bullish breakout scenario will be $0.1118 – a 6% potential rally.
Sellers may have difficulty denting bullish sentiment beyond $0.1020. Contrary to this assumption, sellers may gain more leverage if they overcome this obstacle. A close below $0.1018 could expose XLM to more selling pressure, which could sink it toward $0.0964.
Meanwhile, the RSI retreated from the overbought zone – a decline in buying pressure. But the RSI may rebound from the equilibrium level if the past trend repeats. However, a bearish MACD crossover showed sellers’ increasing market influence, at the time of writing.
CVD spot flattens: funding rates fluctuate
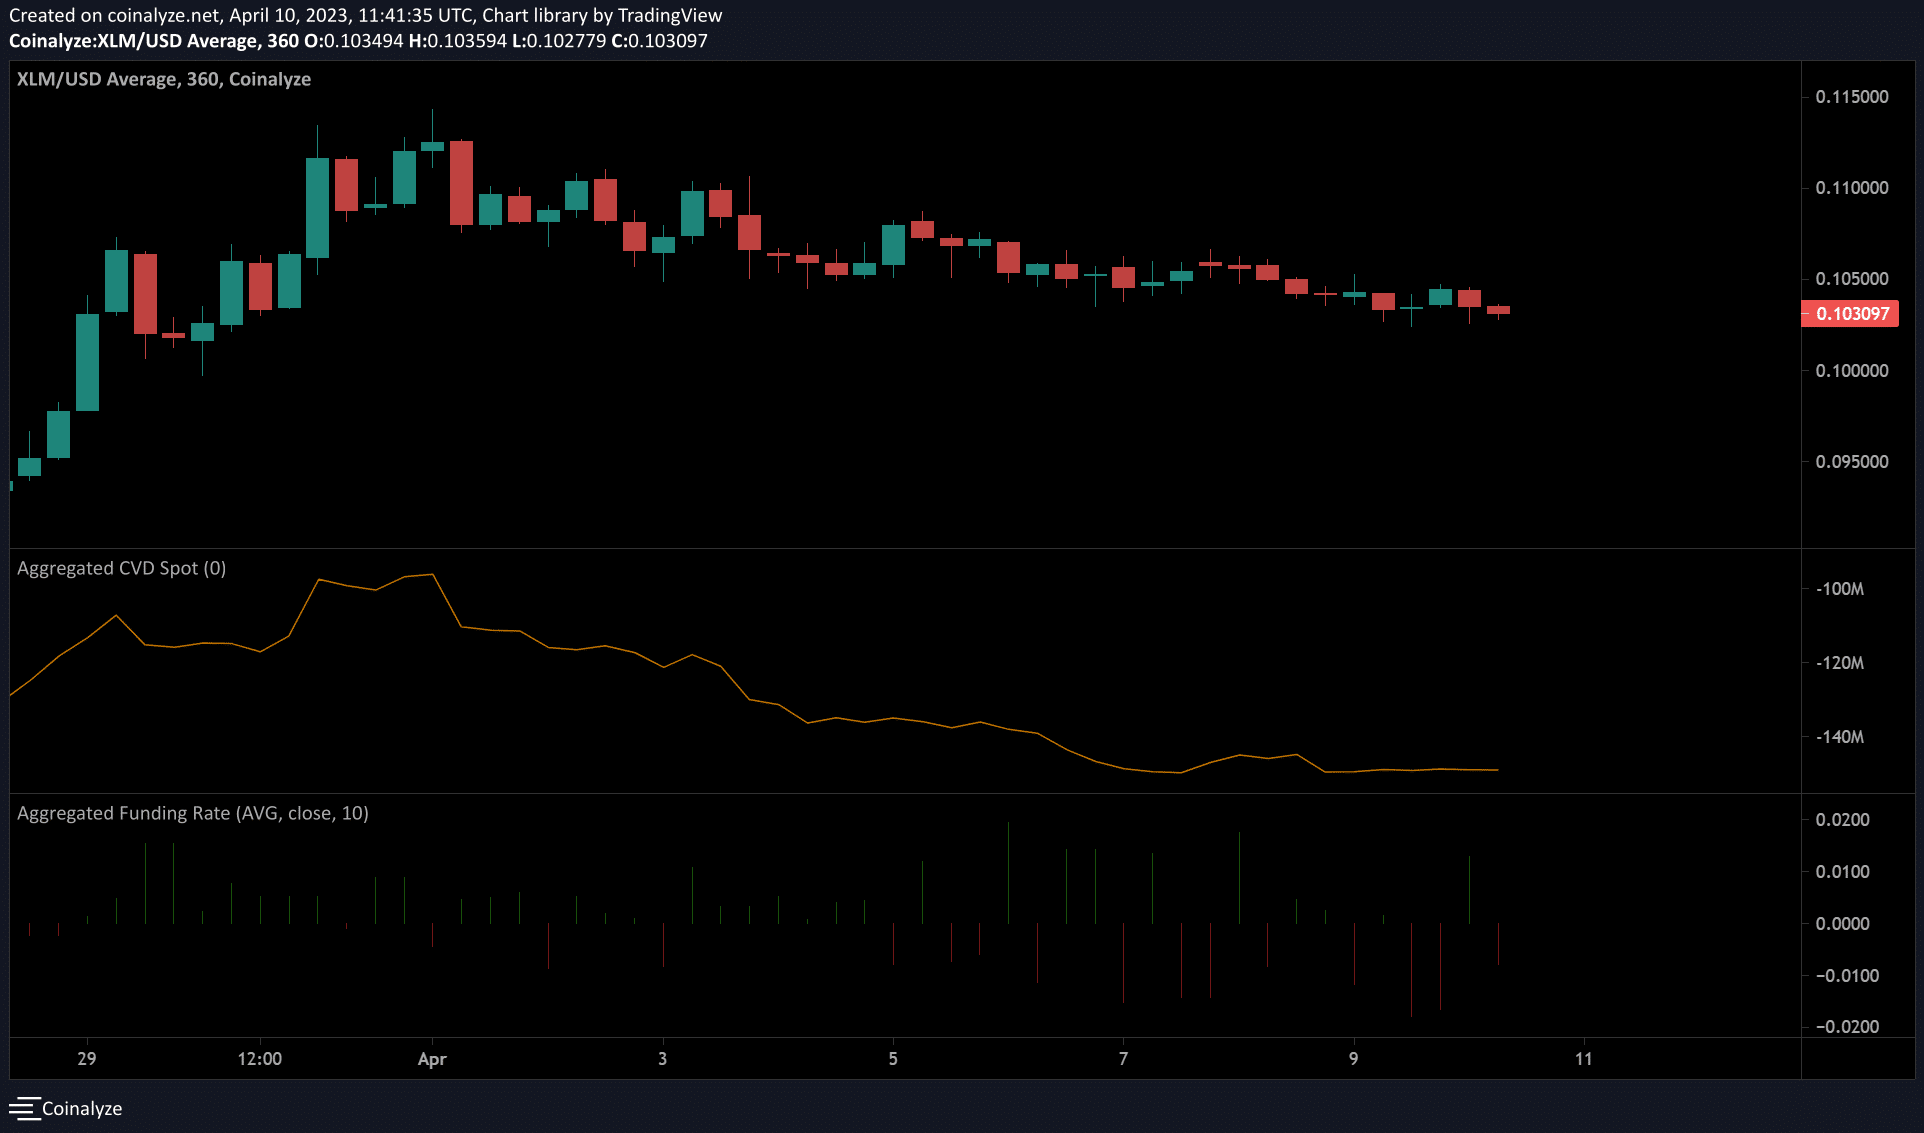
Source: Coinalyze
The CVD (Cumulative Volume Delta) spot was flat, showing the market could be in accumulation or distribution, and neither buyers nor sellers had absolute control. Therefore, patience may be necessary until the CVD grows or drops to get a definite market direction.
Is your portfolio green? Check XLM Profit Calculator
In addition, the funding rates have fluctuated in the past few days – denoting the consolidation witnessed in the same period. But more short-positons (13K) have been liquidated compared to longs (2K), according to Coinalyze.
It shows shorts paid longs – a mild bullish sentiment. Investors should wait for trend reversal confirmation alongside BTC price action before making moves.