Stellar: HODLing on to XLM may be a good idea because…

Since reaching its three-year high last year, Stellar (XLM) tested its long-term trendline support and flipped it to resistance in December 2021. Since then, it found newer lows as the bears took over the driver’s seat.
A reliable close below the $0.195 support (white) would prepare XLM for a near-term pullback. Post which, it would likely continue its breakout rally from the $0.17-$0.19 demand zone. At press time, XLM traded at $0.1954, down by 1.18% in the last 24 hours.
XLM Daily Chart
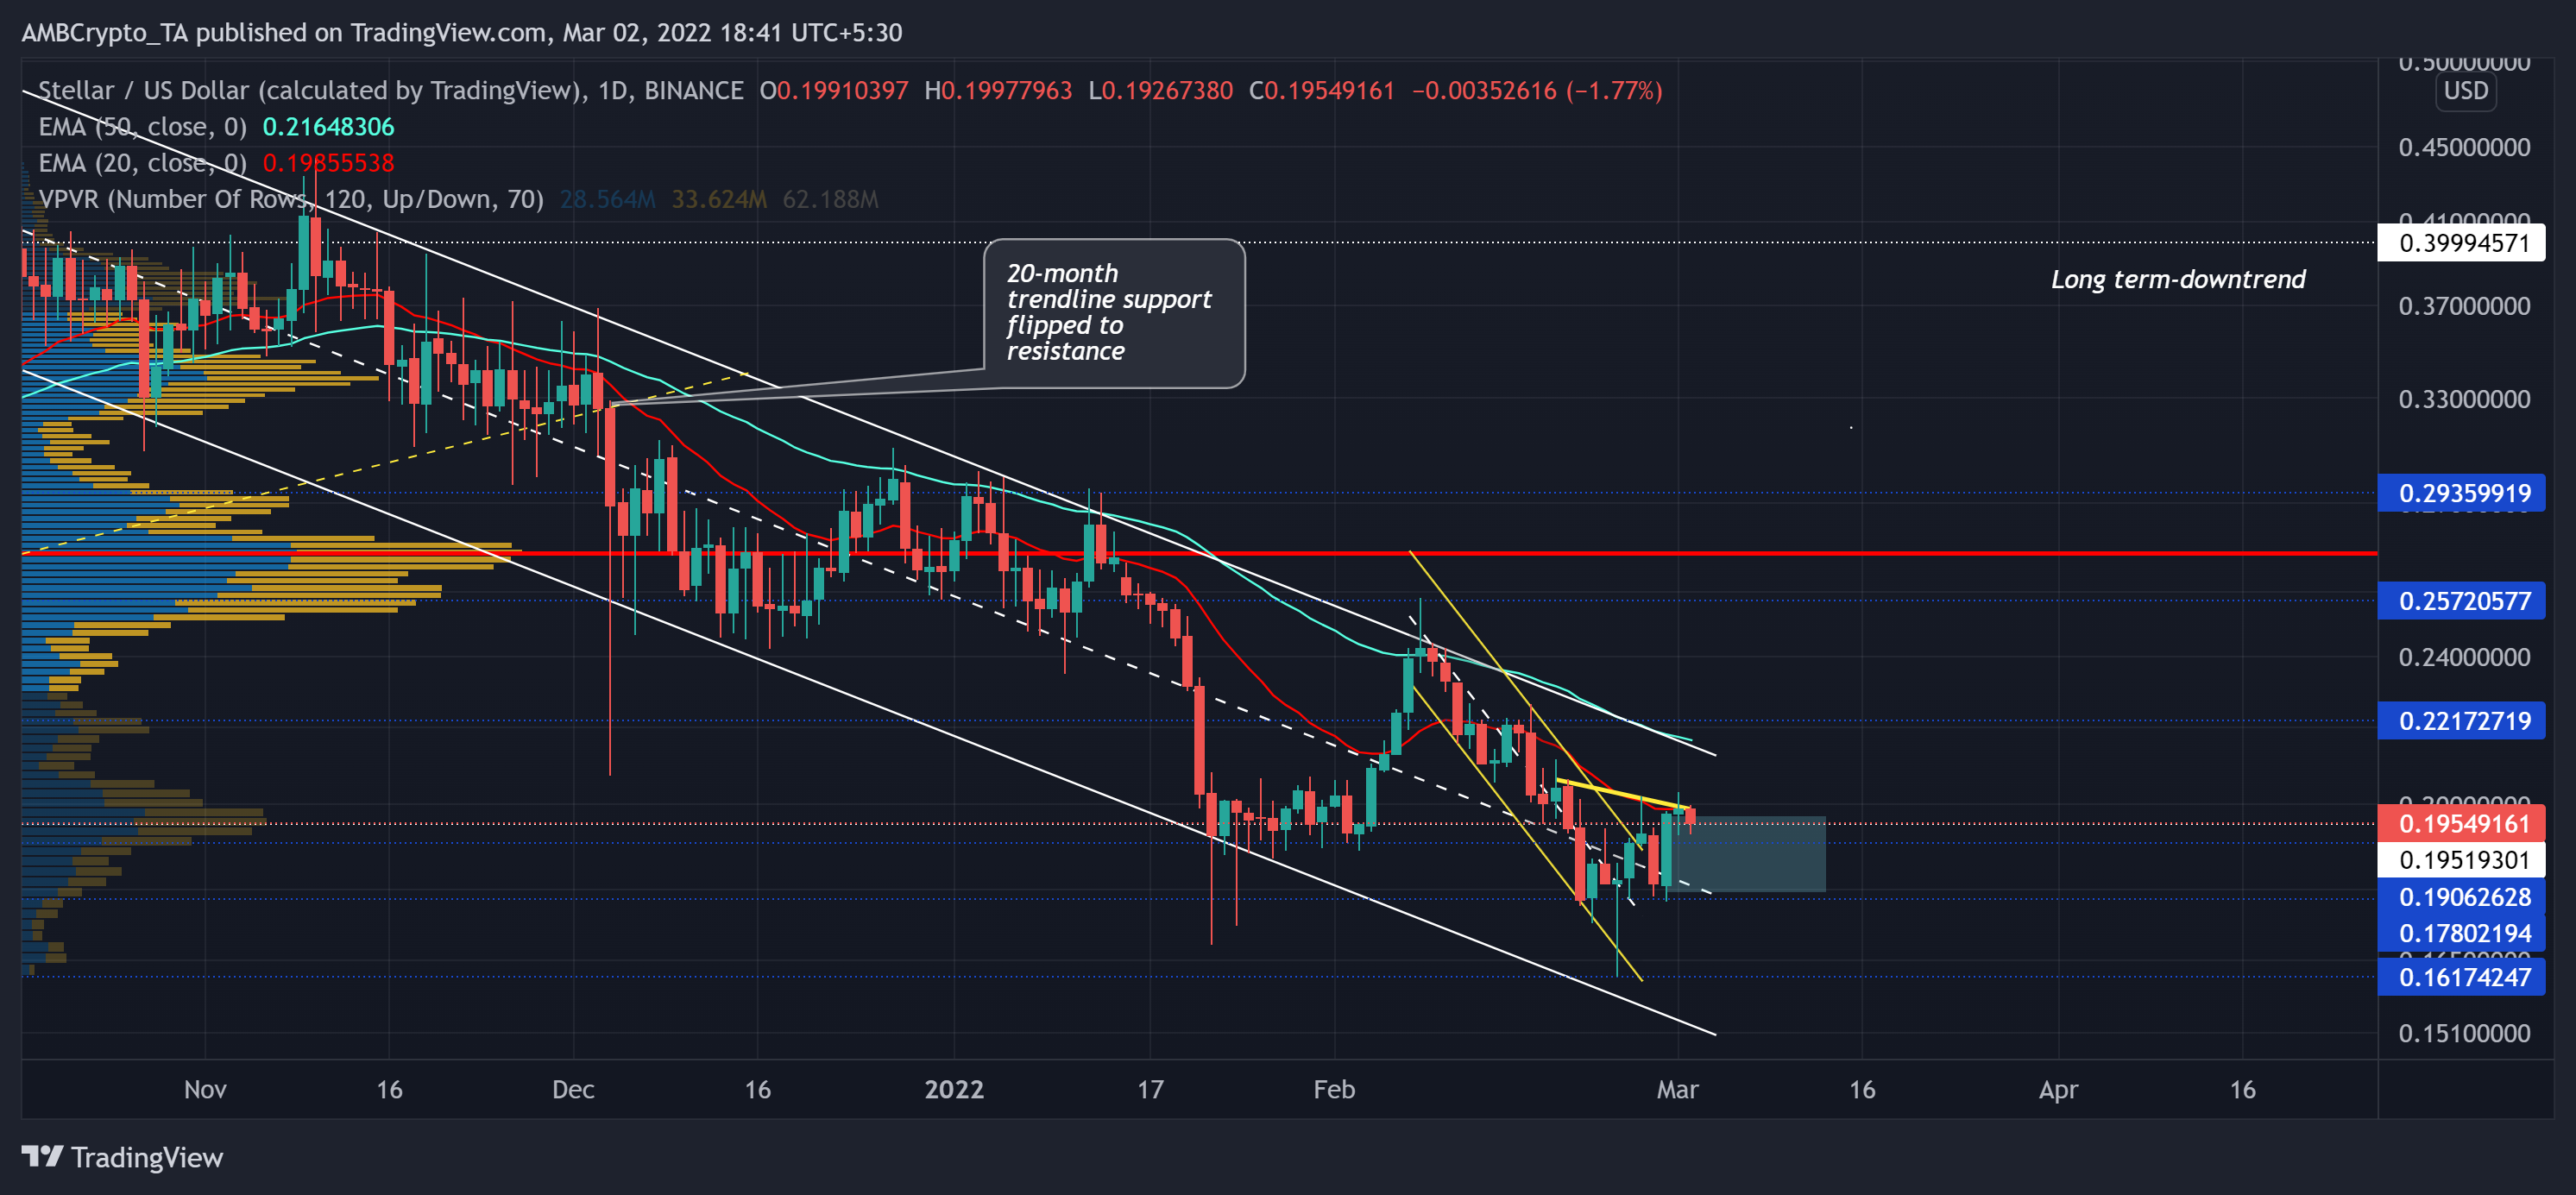
Since XLM struck the $0.8-level, it turned downward and traded between the $0.19-$0.39 range for over eight months. The recent bearish phase marked a down-channel (white) on its daily chart as the alt lost nearly 63.4% (from 10 November) and hit its 13-month low on 24 February.
During this phase, the 20 EMA (red) posed as a strong barrier for the bulls. They strove to find a sustainable close above this level for over three months now. Meanwhile, XLM fell below a crucial area of value at its Point of Control (red). The fall halted at its 14-month ($0.16) support, where the buyers stepped in to initiate a 24.6% recovery that led to a down-channel (yellow) breakout.
With the recent gains, the bulls have created a strong demand zone at the $0.17-$0.19 range. This range has historically been a good trigger for a reversal. Can history repeat itself? If the price finds a close below the $0.195 level, a pullback towards the $0.1906 could be conceivable before the alt picks itself up. Such a revival could test the upper channel that also coincided with its 50 EMA (cyan).
Rationale

The RSI was in an uptrend over the last nine days but still needed to close above the half-line to confirm the change in momentum. Also, the yellow trendline revealed a hidden bearish divergence with price. This reading affirmed the possibility of a pullback towards its support range.
Interestingly, the OBV has been on an uptrend for over a month now, diverging from the price action. Thus, hinting at the underlying buying pressure that would open up gates for a revival from the $0.17-$0.19 level.
Conclusion
Keeping in mind the bearish divergence with RSI, XLM could see a near-term pullback. Following this, the OBV keeps the bullish revival hopes alive from its demand zone. Besides, the investors/traders should factor in the broader market sentiment and the on-chain developments to make a profitable move.