Stellar Lumens Price Analysis: 13 February

Disclaimer: The findings of the following analysis are the sole opinions of the writer and should not be taken as investment advice
Stellar Lumens’ price has risen significantly on the charts since the start of the month. In fact, the coin’s uptrend was able to flip the resistance levels into key levels of support over the past two weeks, with the same attempting to breach a key level around the $0.61-price point, at the time of writing. If the coin fails to flip this resistance level, then XLM may be setting itself up for a minor correction resulting in a trend reversal.
At press time, XLM was being traded at $0.57 with a 24-hour trading volume of $4.8 billion after having witnessed its price hike by over 68 percent in the last 7 days.
Stellar Lumens 1-day chart
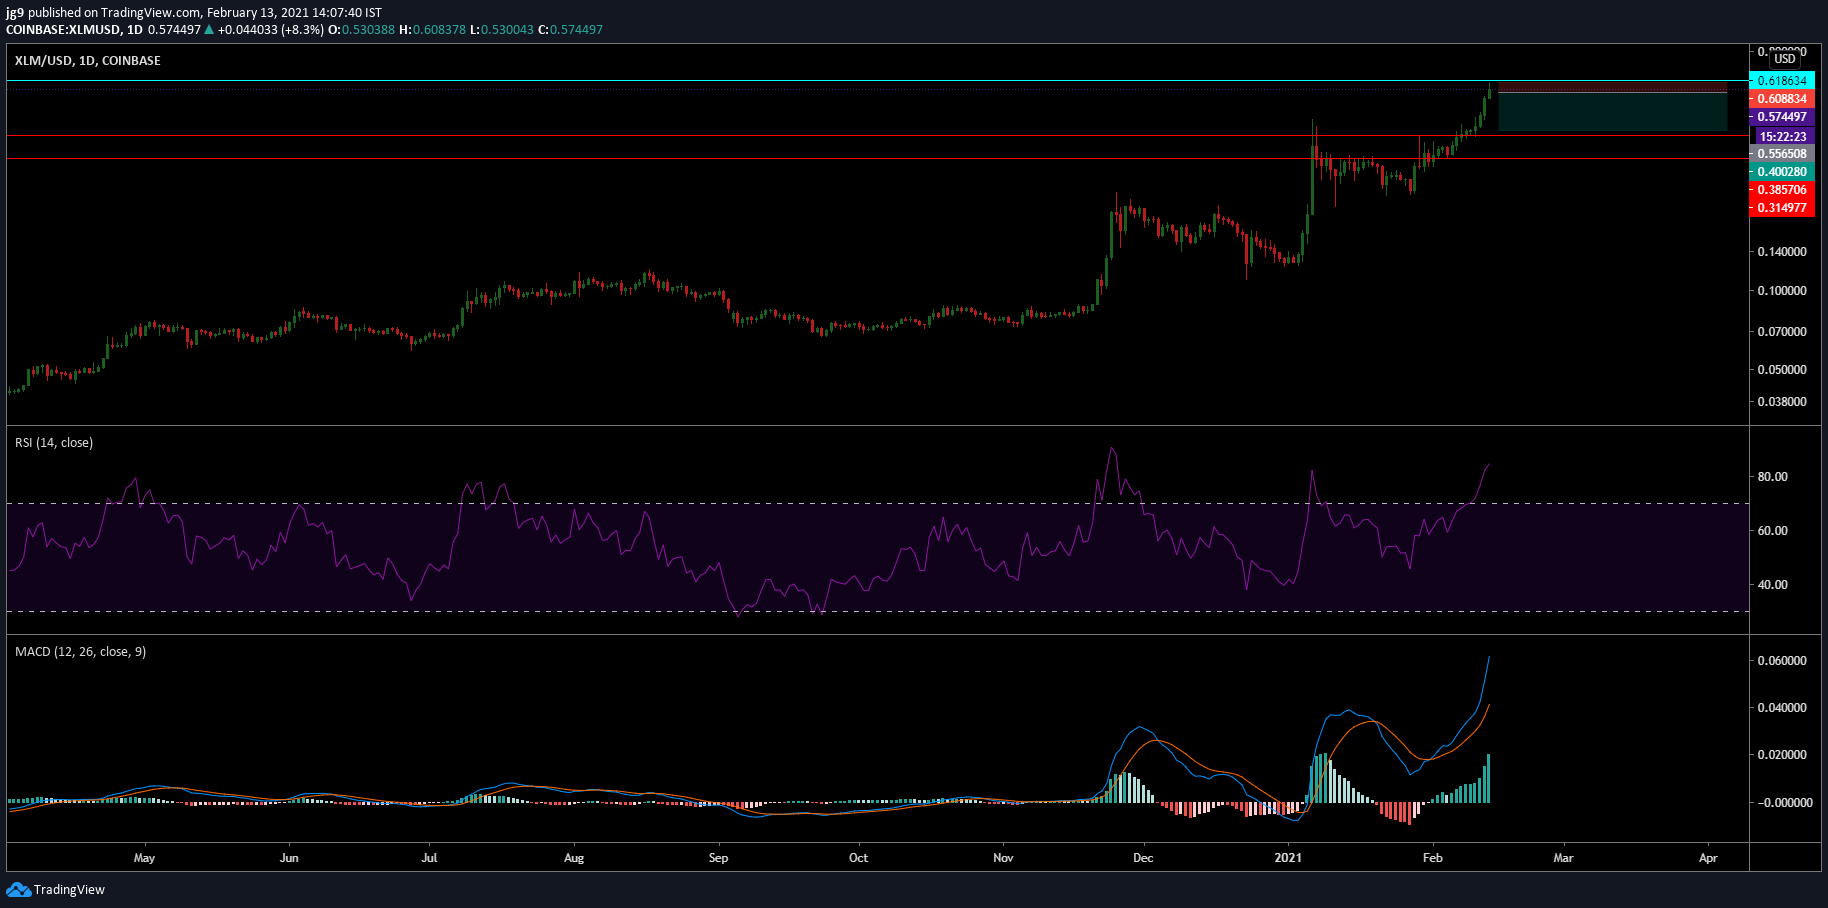
The daily chart for the cryptocurrency highlighted the uptrend XLM has been able to sustain since the start of February. Even in the 24 hours before press time, XLM was registering strong bullish momentum, enabling the coin to surge by over 26 percent.
At press time, the cryptocurrency was trying to breach the resistance around the $0.61-price level. If this fails, XLM may drop down to its immediate support at $0.38. There was also another support around the $0.31-mark, if the situation takes a turn for the worse. However, a dip to the second support level also seemed unlikely given the sentiment in XLM’s market.
Here, traders can benefit from a short position over the coming week if the coin’s resistance level remains, a development that is likely to trigger a price correction on the charts.
Rationale
The technical indicators for XLM, at the time of writing, highlighted bullish sentiments. However, that doesn’t rule out the possibility of a trend reversal in the coming days. The RSI was well into the overbought zone and if one were to take the coin’s historical price data into account, the last time the RSI stayed at such a level, it was soon followed by a steep plunge in the opposite direction as evidenced at the start of 2021.
Further, the MACD line was well above the Signal line – a sign of bullishness in the XLM market.
Important levels to watch out for
Resistance: $0.61
Support: $0.38, $0.31
Entry: $0.55
Take Profit: $0.40
Stop Loss: $0.60
Risk/Reward: 2.99
Conclusion
XLM’s price has been on a steady uptrend and noted strong bullish sentiment. However, if the coin fails to flip its immediate resistance into a level of support in the coming days, the coin may be subject to a trend reversal. This would result in the coin dropping to its immediate support in the coming days.


