Stellar Lumens, STEEM, FTX Token Price Analysis: 17 March

Stellar Lumens presented targets above the 50-SMA and 200-SMA for a bullish recovery on the charts. Finally, STEEM met with rejection once again around the 50% Fibonacci retracement level while FTT hovered just above the $38.7-support, at the time of writing.
Stellar Lumens [XLM]
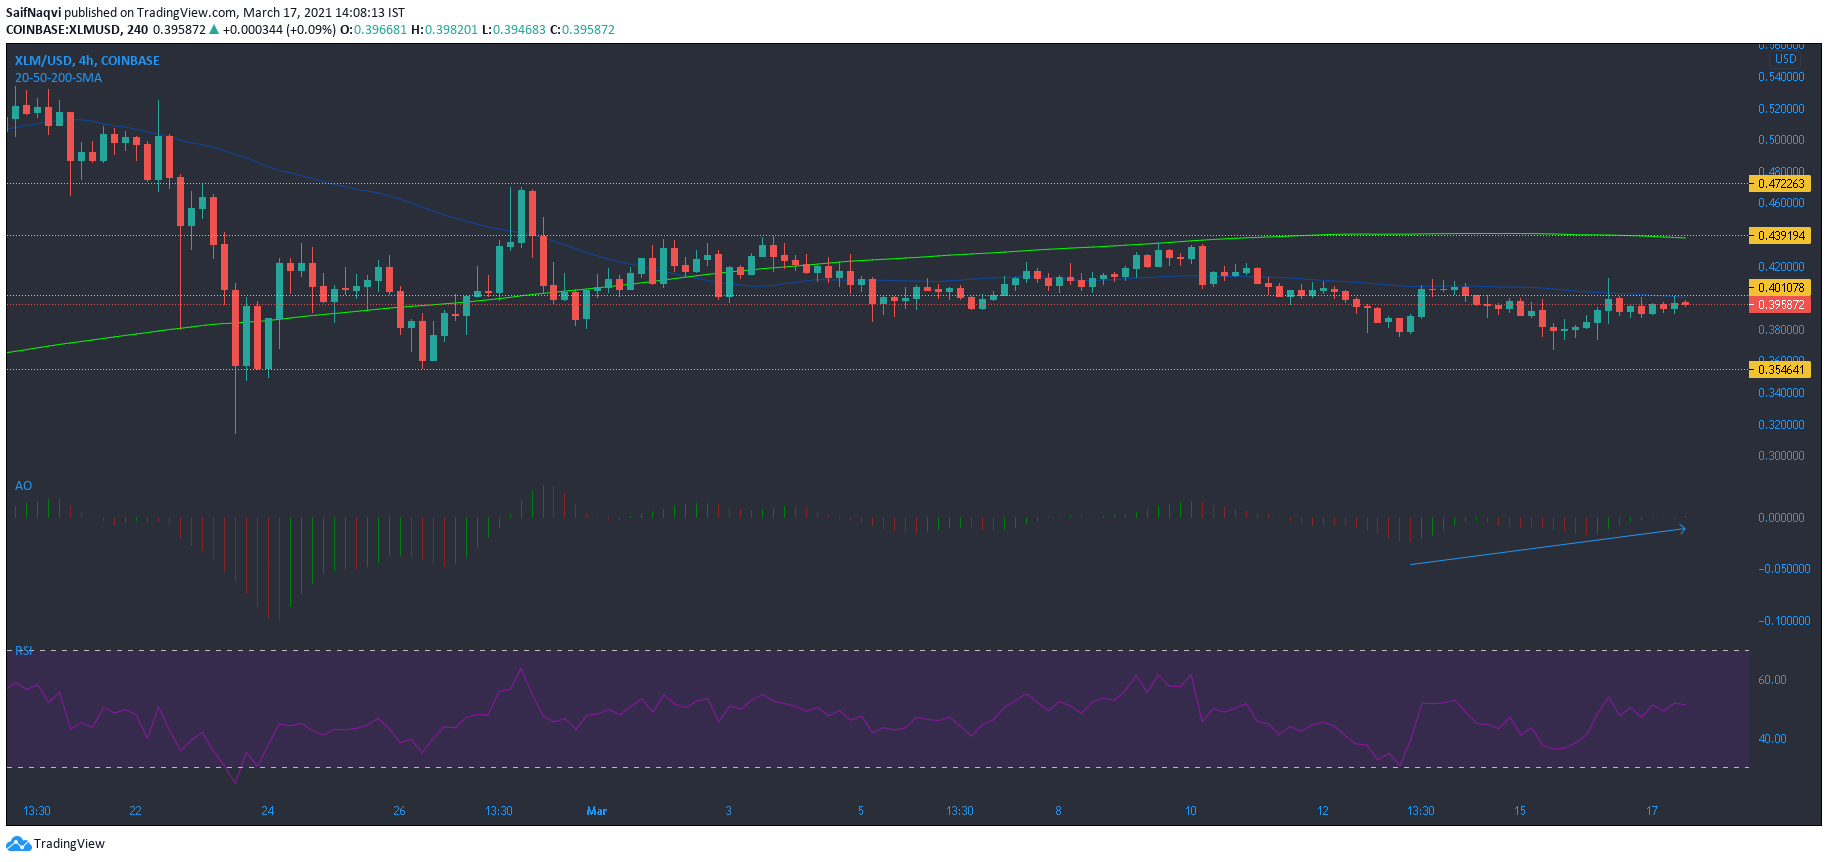
Since snapping a local high over $0.6, Stellar Lumens’ market has been under the pump. Its market price nearly halved from the aforementioned local high to its lowest point of $0.31 in late-February. From that point, the price has generally remained subdued under the $0.43-resistance. In fact, losses over the past 30 days amounted to almost 20%, a worrying sign for the market’s bulls.
For recovery, the bulls have to overcome several obstacles along the way. A hike above the 50-SMA (blue) would be a step in the right direction. The second would be to target a move above the $0.43-resistance, a level that coincided with the 200-SMA (green).
Successfully rising above these points would initiate a comeback in the long-run. A bullish twin peak setup on the Awesome Oscillator suggested that XLM was making some headway in clearing the first hurdle at the 50-SMA. However, the RSI rested around the 50-mark and showed equilibrium in the market.
STEEM
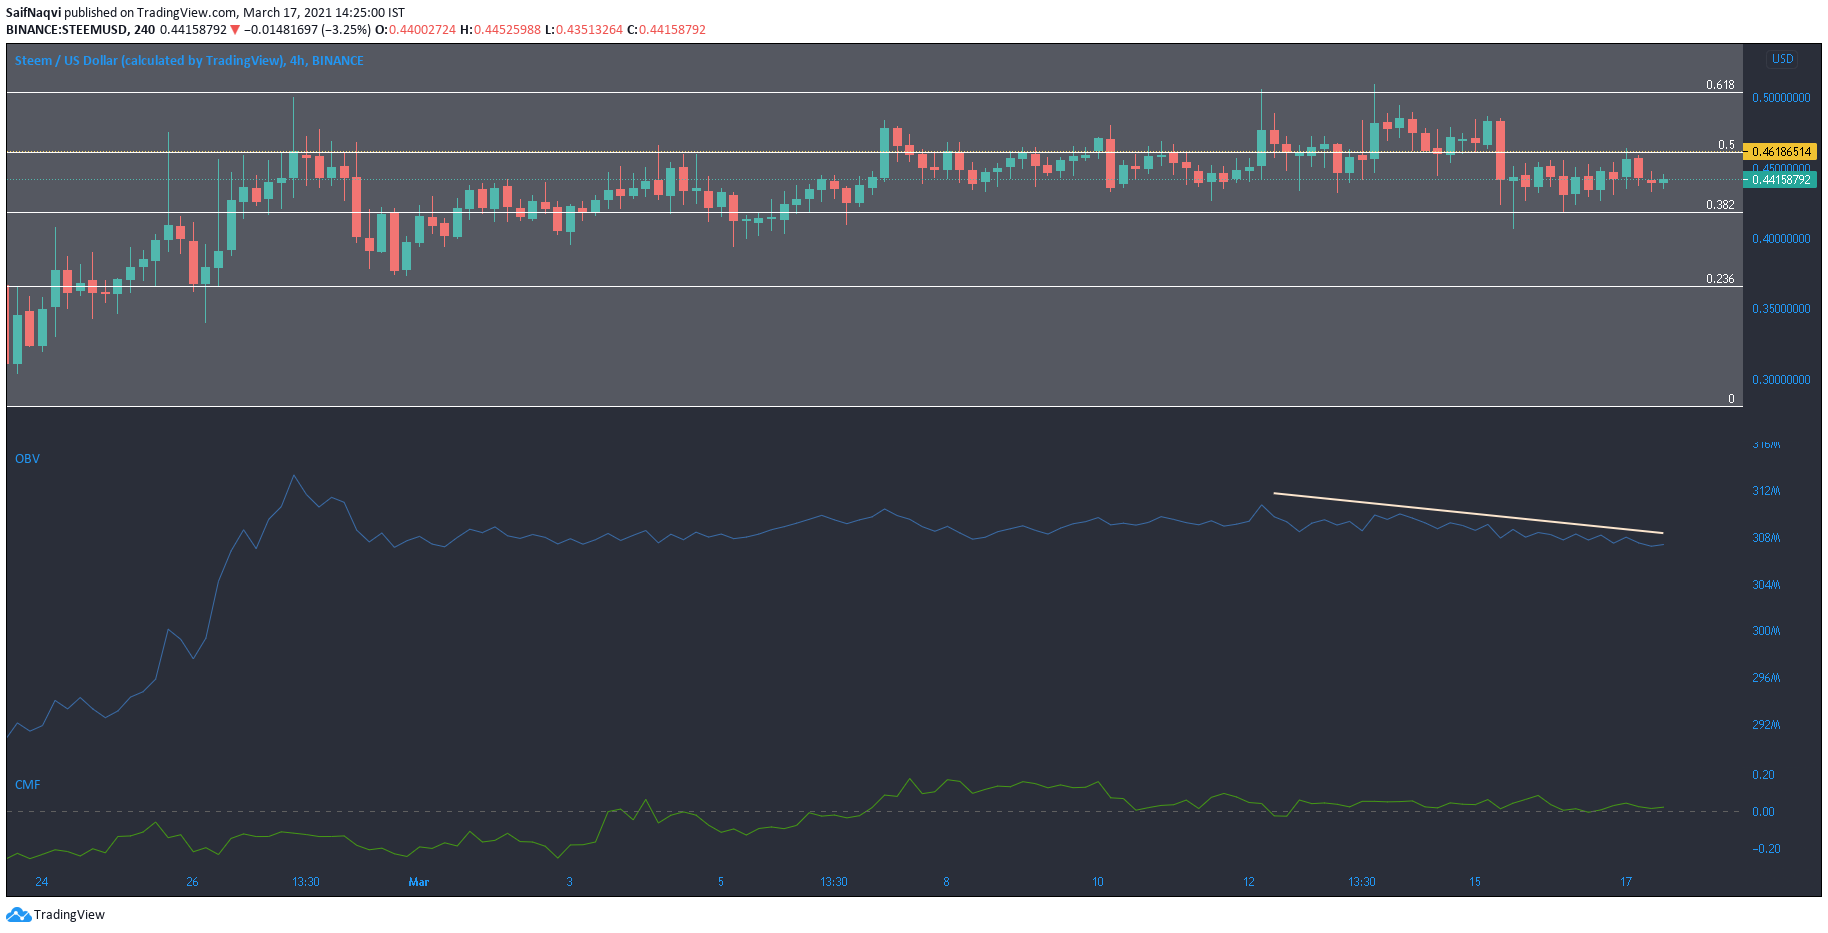
The 50% Fibonacci retracement level, which lay at the $0.46-mark, was controlled by the sellers as STEEM was rejected at that level on multiple occasions. The OBV took a dip at the aforementioned level and showed that sellers countered the northbound move. Lower highs on the OBV highlighted the selling pressure prevalent in the market.
On the plus side, the Chaikin Money Flow stayed above the half-mark and indicated steady capital inflows. A move below the press time channel was unlikely, and a northbound breakout could follow after the end of a consolidation period.
FTX Token [FTT]
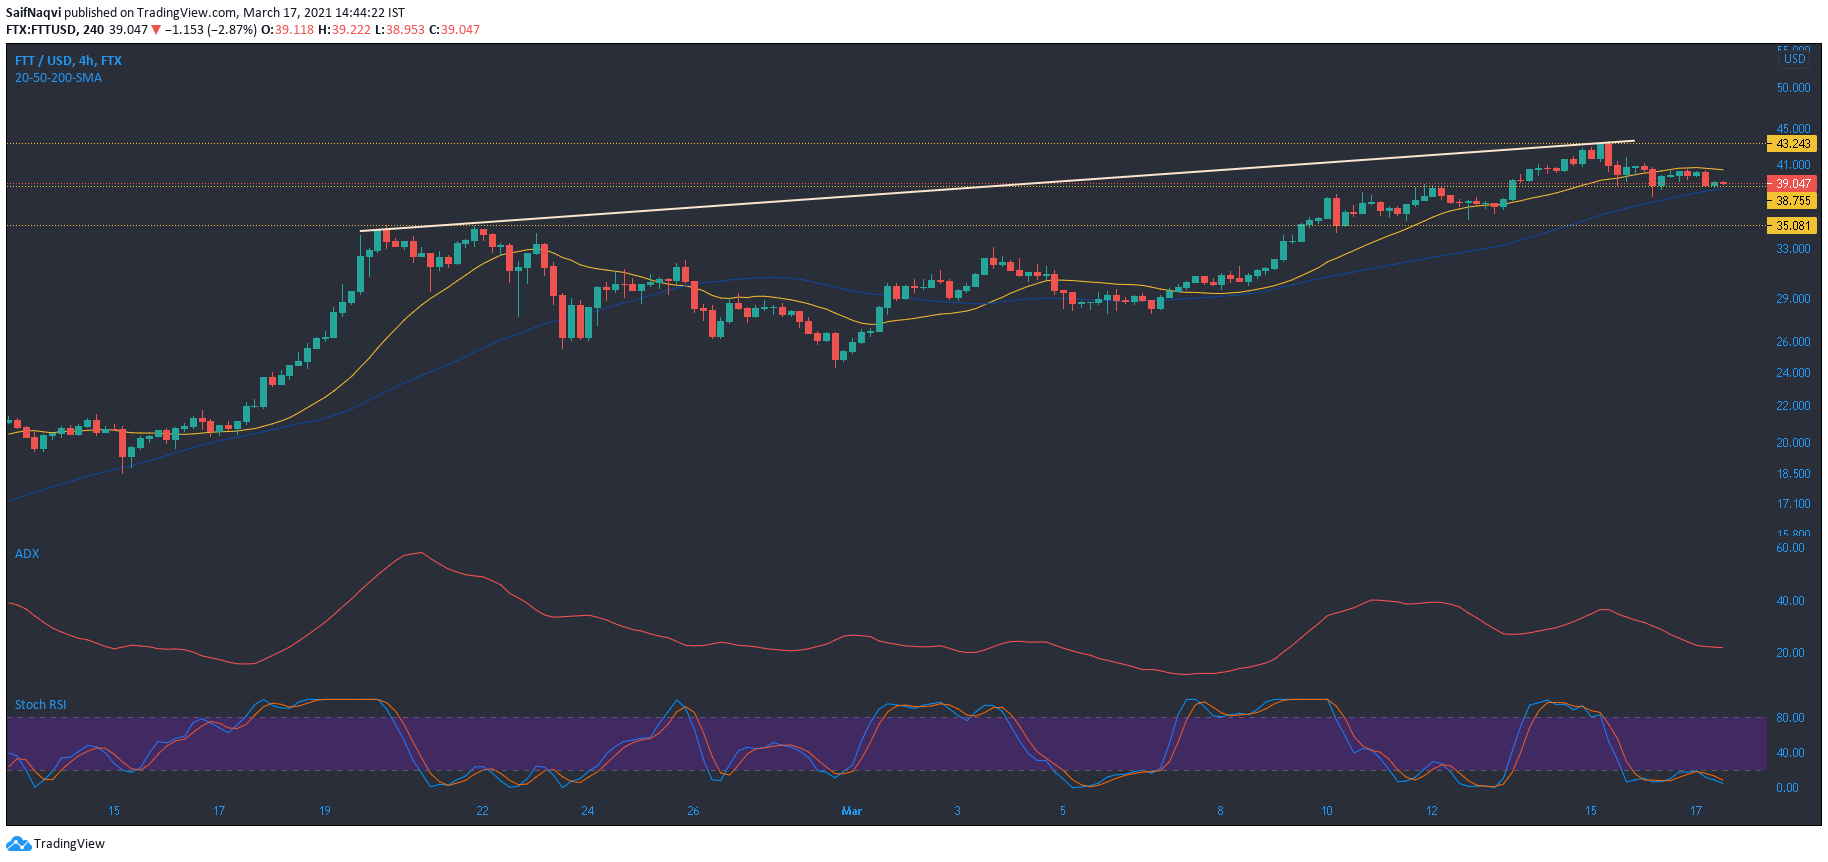
A fall from the $42.4-resistance to $38.7-support represented a drop of over 8% as FTX Token stabilized after trading at record levels. The larger picture still showed an uptrend for FTT, while monthly gains amounted to over 90%.
On the other hand, some short-term weakness was shown as the candlesticks moved below their 20-SMA (yellow), but the 50-SMA (blue) acted as a buffer against a drop below the press time support.
An ADX reading below 25 suggested that the bulls were losing strength, while the Stochastic RSI continued its movement in the oversold zone. Moving forward, the bulls might need to counter some selling pressure before pushing FTT to record levels.