Stellar Lumens, Steem, Maker Price Analysis: 22 January

Stellar Lumens registered significant losses recently. However, since a lot of the asset wasn’t sold on the market, XLM could see some upside in the next day or two. STEEM also showed signs that it was poised for a bounce while Maker slipped under a triangle pattern and could move towards $1000 on the price charts.
Stellar Lumens [XLM]
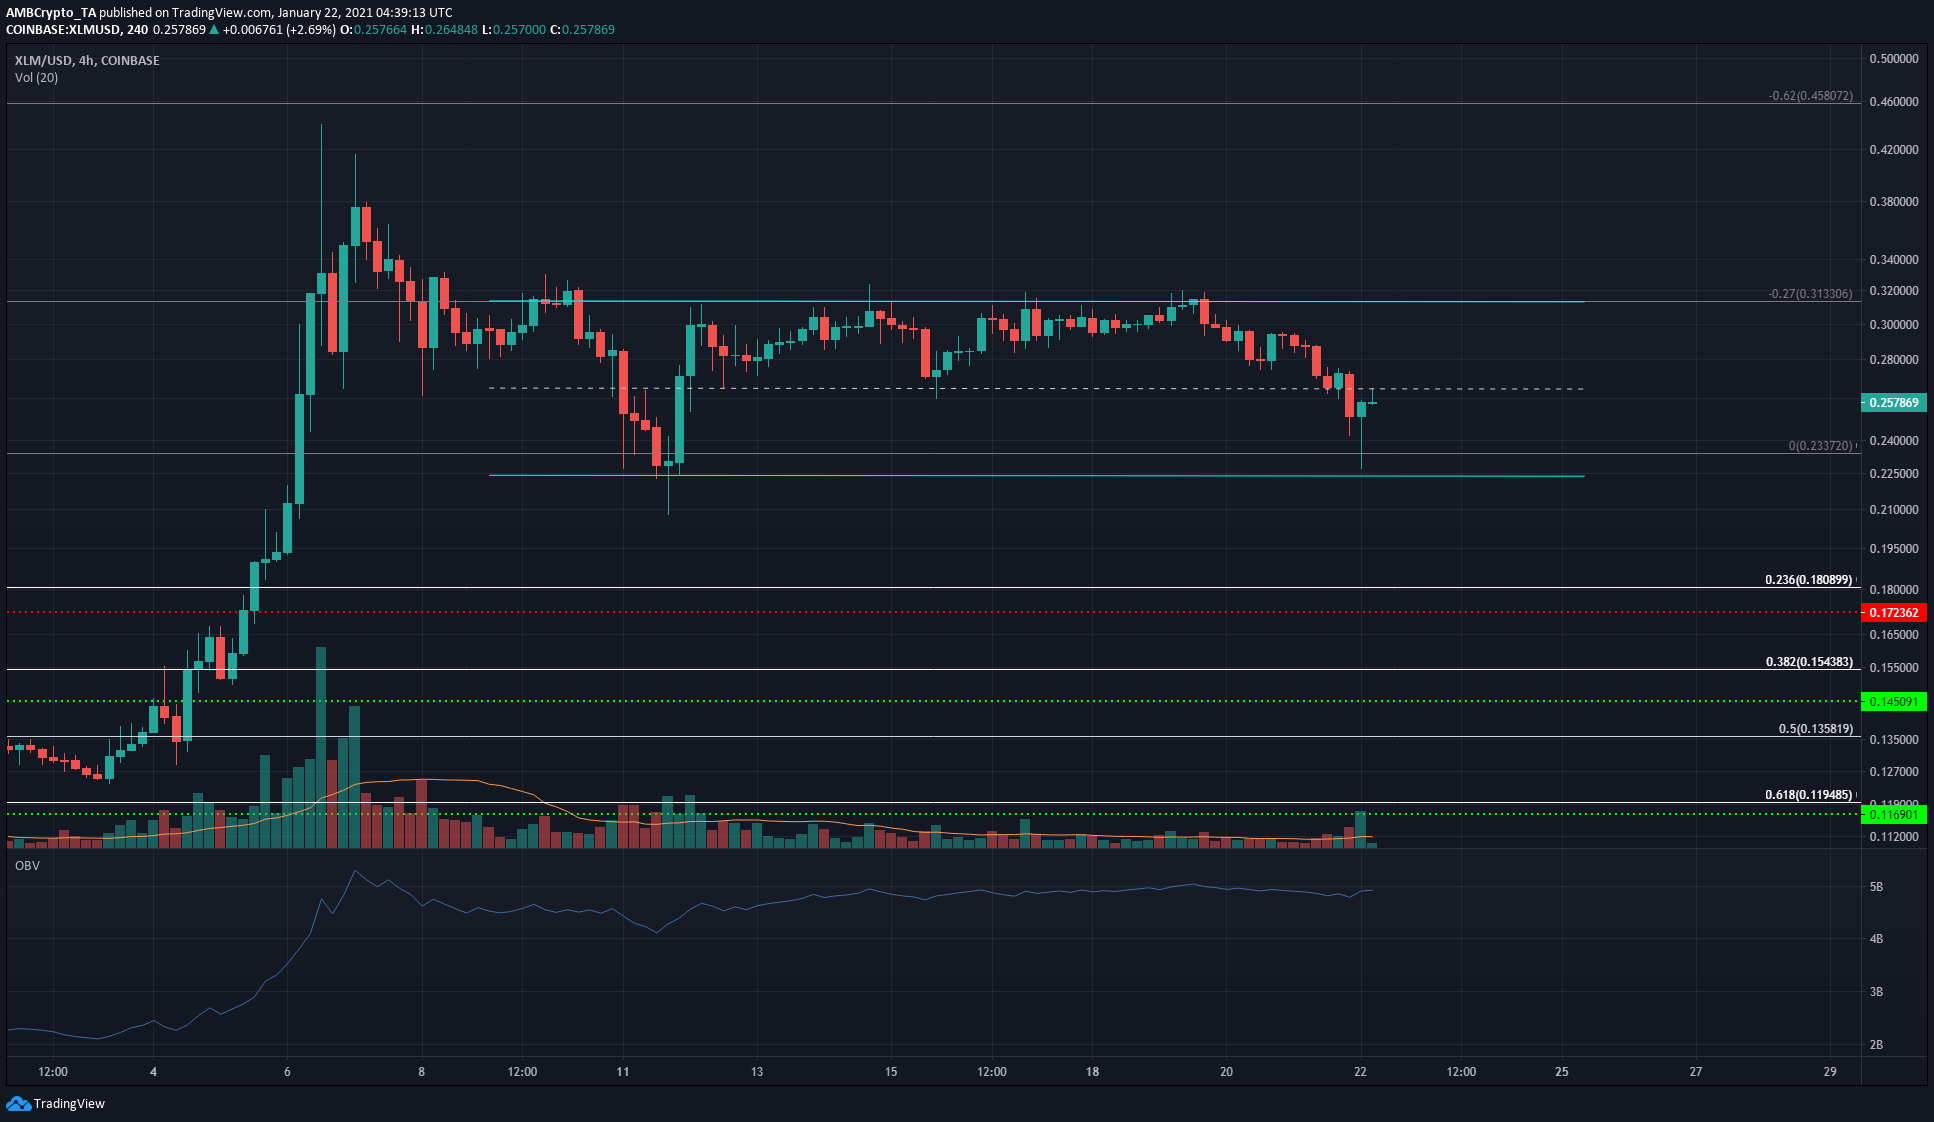
While Stellar Lumens did not show strength in the market with regard to its price, there was reason to believe that XLM was heading back towards the range high at $0.31. The trading volume was low over the past few days, and the OBV showed that there was not a significant volume of XLM sold over the past few sessions, despite strong losses.
The range lows at $0.223 offered some pushback and at the time of writing, XLM was trading under the mid-point of the range at $0.264.
While the momentum seemed bearish, rising above the mid-point and defending that level will be a reason to conclude that XLM is likely to move towards $0.31 once more.
Steem [STEEM]
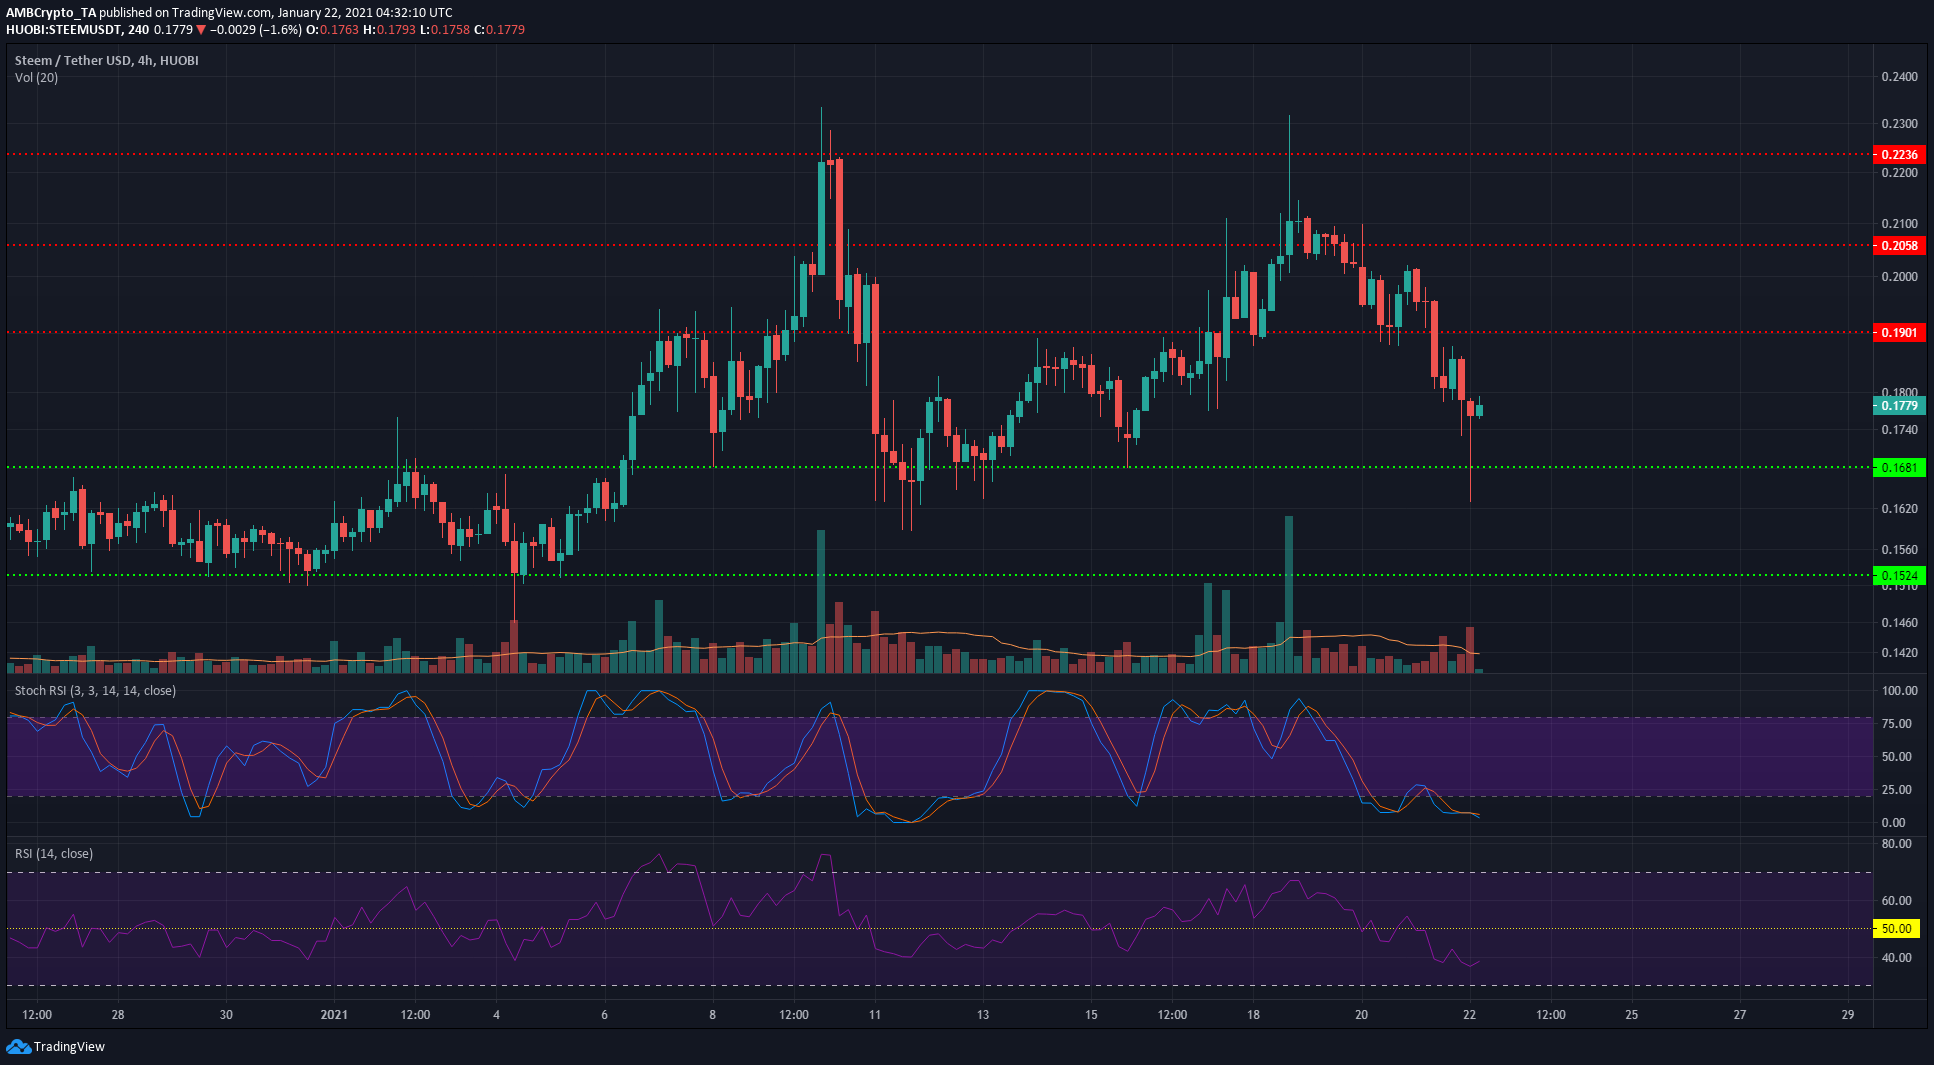
STEEM registered a local high at $0.22 earlier this month and set a lower high at $0.211 a few days ago. Since then, it has faced strong selling pressure, with the crypto trading at $0.177, at the time of writing.
It saw a candlewick below the $0.168-support level, but that was quickly bought up. The RSI registered a value of 38, indicating bearish momentum. Further, the Stochastic RSI was deep within the oversold territory.
Combined with the buying pressure that drove the price all the way up from the wick to $0.164, it could be that STEEM is poised to attempt a bounce to the $0.185-$0.19 region. The reaction there will set its next direction.
Maker [MKR]
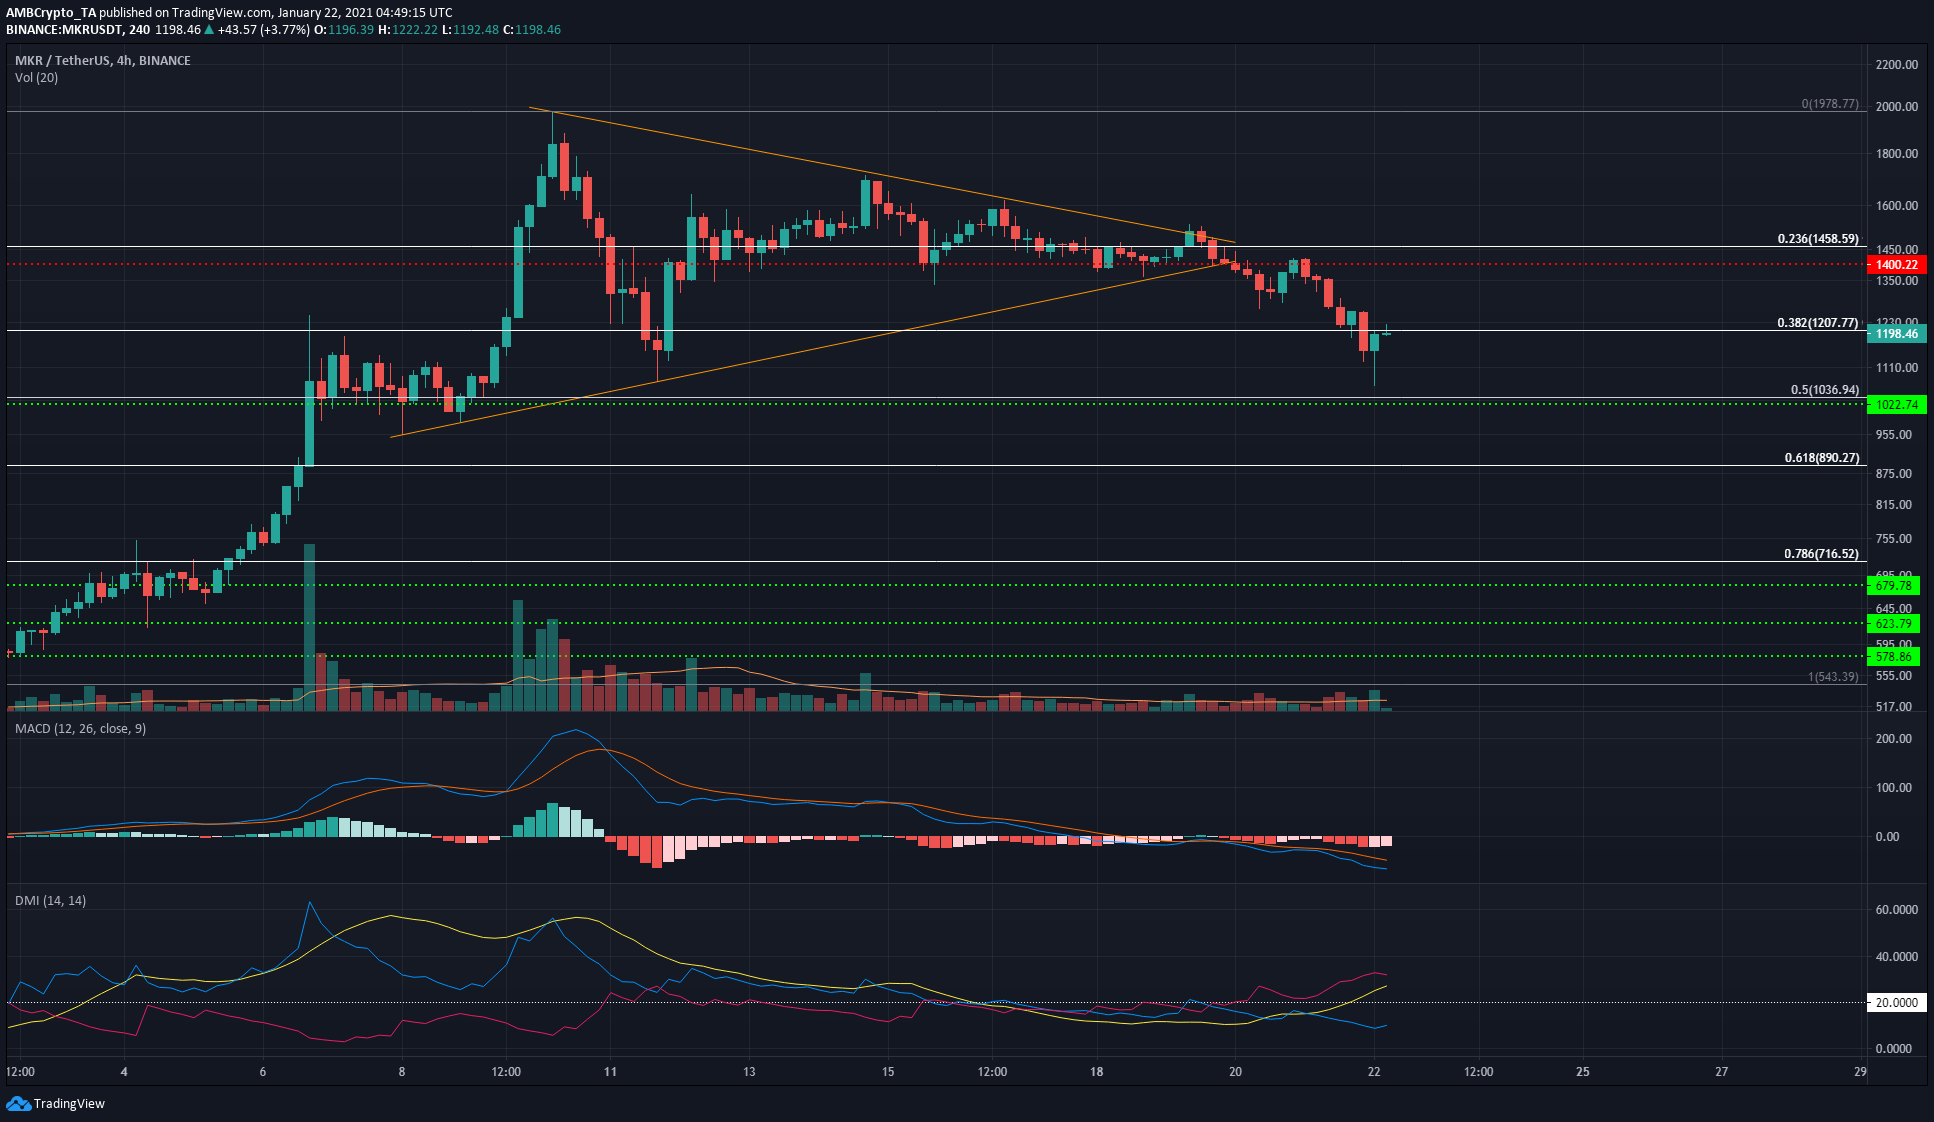
The MACD was steadily falling further into bearish territory after MKR closed under a symmetrical triangle pattern and re-tested the $1400-level as resistance. The Directional Movement Index also showed that the -DMI (pink) and ADX (yellow) were both climbing past 20 on the charts to show that a strong downtrend was in progress.
The 38.2% level at $1200 could offer support to MKR, should it flip the level to support in the coming hours. Further downside for Bitcoin towards $27.7k will likely see MKR move towards $1000 as well.


