Stellar (XLM) flips SUI after 11% surge – Mapping its next price target

- Stellar has flipped SUI by market capitalization after gaining by over 11% in 24 hours
- XLM’s rally can attributed to buying pressure, with the RSI nearing overbought zones
Stellar (XLM) has flipped SUI (SUI) by market capitalization after gaining by more than 11% in 24 hours. At press time, XLM, which now ranks as the 12th-biggest crypto with a market capitalization of $14.21 billion, was trading at a weekly high of $0.467,
XLM could be poised for more gains due to a bullish outlook on its lower timeframe chart – A sign that it could hit a multi-week high of $0.52 in the short term.
XLM eyes further gains
Stellar formed a double bottom pattern on its four-hour chart, suggesting that a bullish continuation was imminent. In fact, it also flipped crucial resistance at the neckline of this pattern, an indication that the uptrend seemed strong.
The next target for the price now lies at the 1.618 Fibonacci extension level ($0.52). This upswing will see XLM claim monthly highs.
Volume histogram bars revealed that buyers are behind this surge after buying volumes hit $154M. The Relative Strength Index (RSI) also confirmed this after rising to 71 – A sign that XLM may be close to being overbought.
The Moving Average Convergence Divergence (MACD) indicator also highlighted bullish momentum. At the time of writing, the MACD line was positive and tipping north, highlighting that bulls have been in control.
Long traders could derail XLM’s rally
Stellar’s recent gains saw more than $1.5M in short positions being wiped out. The liquidations seem to have stirred the demand for long positions after funding rates flipped positive, as per Coinglass. This outlook revealed that long traders are now willing to pay a fee to maintain their positions.
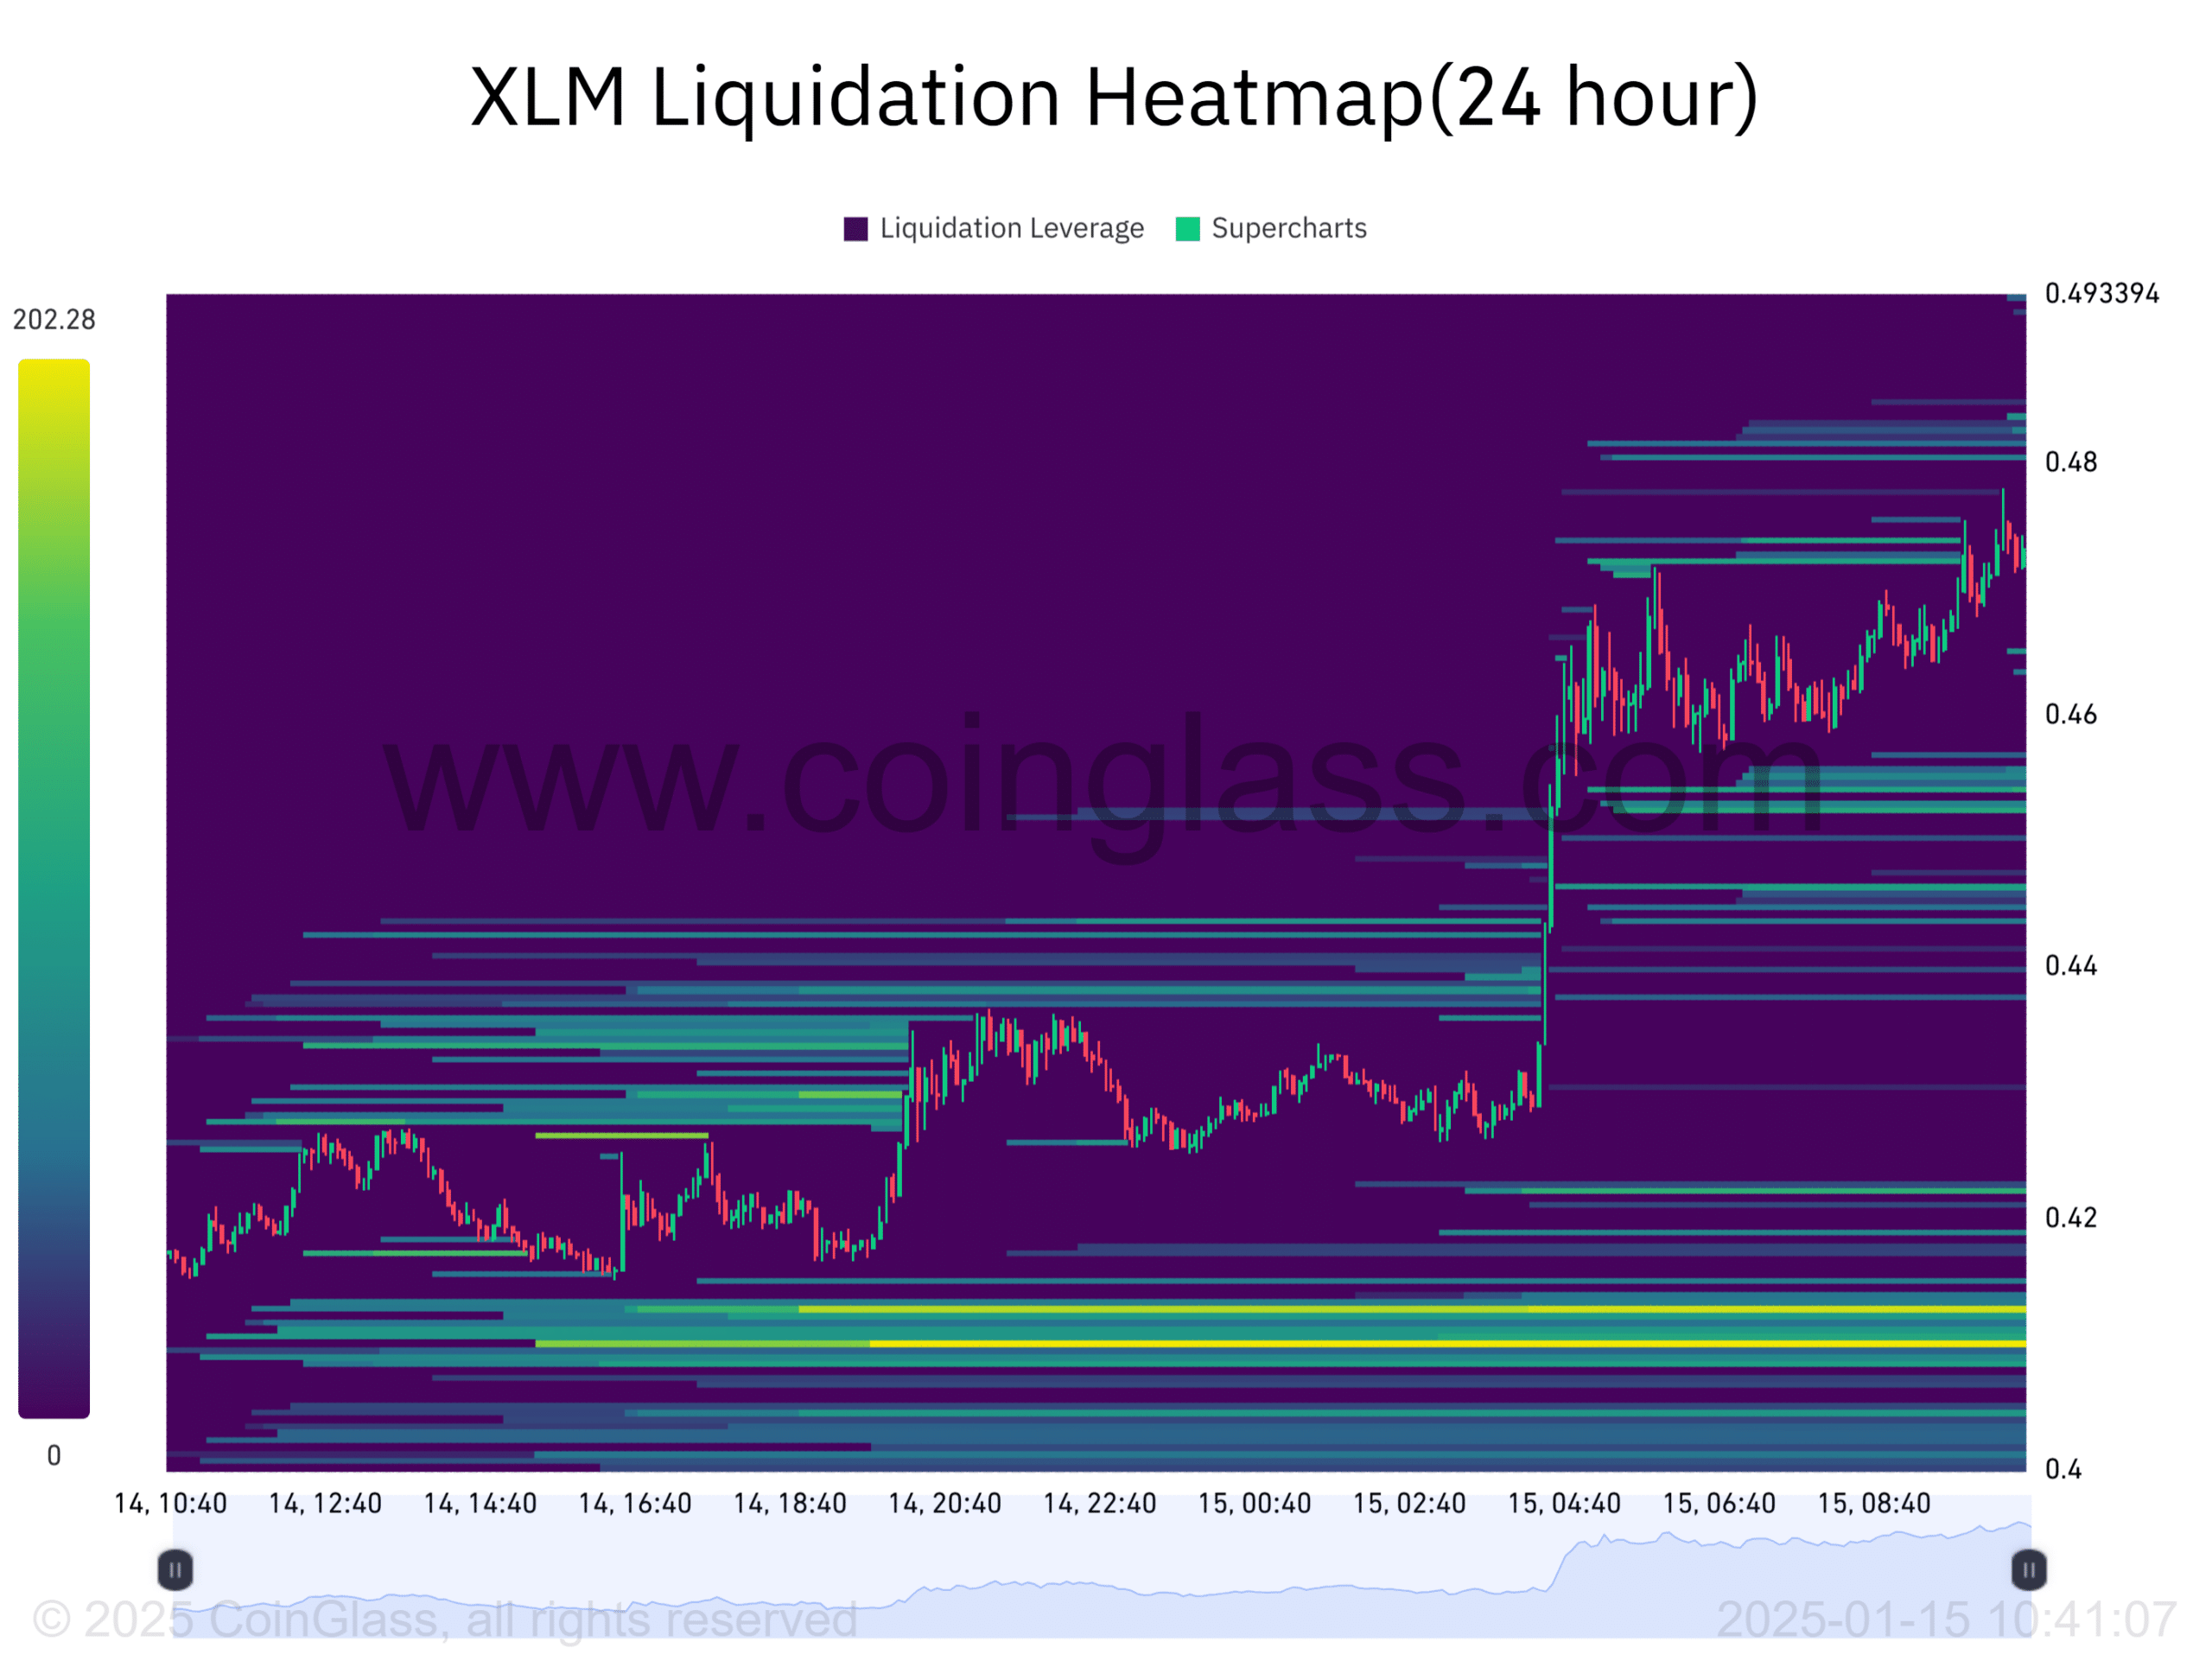
XLM’s liquidation heatmap with a 24-hour lookback period highlighted these short liquidations as the price rose. However, there are clusters of liquidation levels below the price that could act as magnet zones and pull XLM lower.
The main liquidation zone to watch is at $0.40 – $0.41. Many long traders are at risk of being liquidated at this price level. If there is an unexpected dip, it could trigger a steep downtrend as these traders begin to close their positions.
Can XLM emerge as a top ten crypto?
Following the latest surge in its market cap, XLM is now inching closer to flipping Avalanche (AVAX), whose market cap stands at $15.34 billion. For it to become a top ten crypto, it needs to add more than $5 billion to its market cap to overtake Tron (TRX).
Such an uptick could happen given that in the first five days of 2025, XLM’s market cap rose from around $9.8 billion to $14 billion. However, these gains will depend on whether Stellar can continue and sustain its uptrend.


![Ethereum's [ETH] 11% rebound - Is greed fueling a bottom or is fear driving a trap?](https://ambcrypto.com/wp-content/uploads/2025/04/Ritika-8-400x240.webp)