STEPN’s 10.7% surge may excite investors, but the excitement may be temporary

STEPN [GMT], a Web3 lifestyle application with social and game elements, recently registered a massive decrease in its user base. In the month of February, STEPN’s user base surged considerably, as it grew more than 100 times in the next few months.
However, a recent report from Messari suggested that things have changed quite a bit as STEPN’s daily active users dropped by 80%. Not only DAUs, but new users have also decreased from 20% to 5% of STEPN’s total user base.
.@Stepnofficial's daily active users have dropped by 80%.
New users have decreased from 20% to 5% of STEPN’s total user base. pic.twitter.com/hVQN8GHDrA
— Messari (@MessariCrypto) September 10, 2022
Despite this change, GMT did not seem to hold back as it registered more than 14.5% 24 hour gains. This is higher than several cryptos with a larger market capitalization. At press time, GMT was trading at $0.7681 with a market cap of $460,851,414
A quick metric look
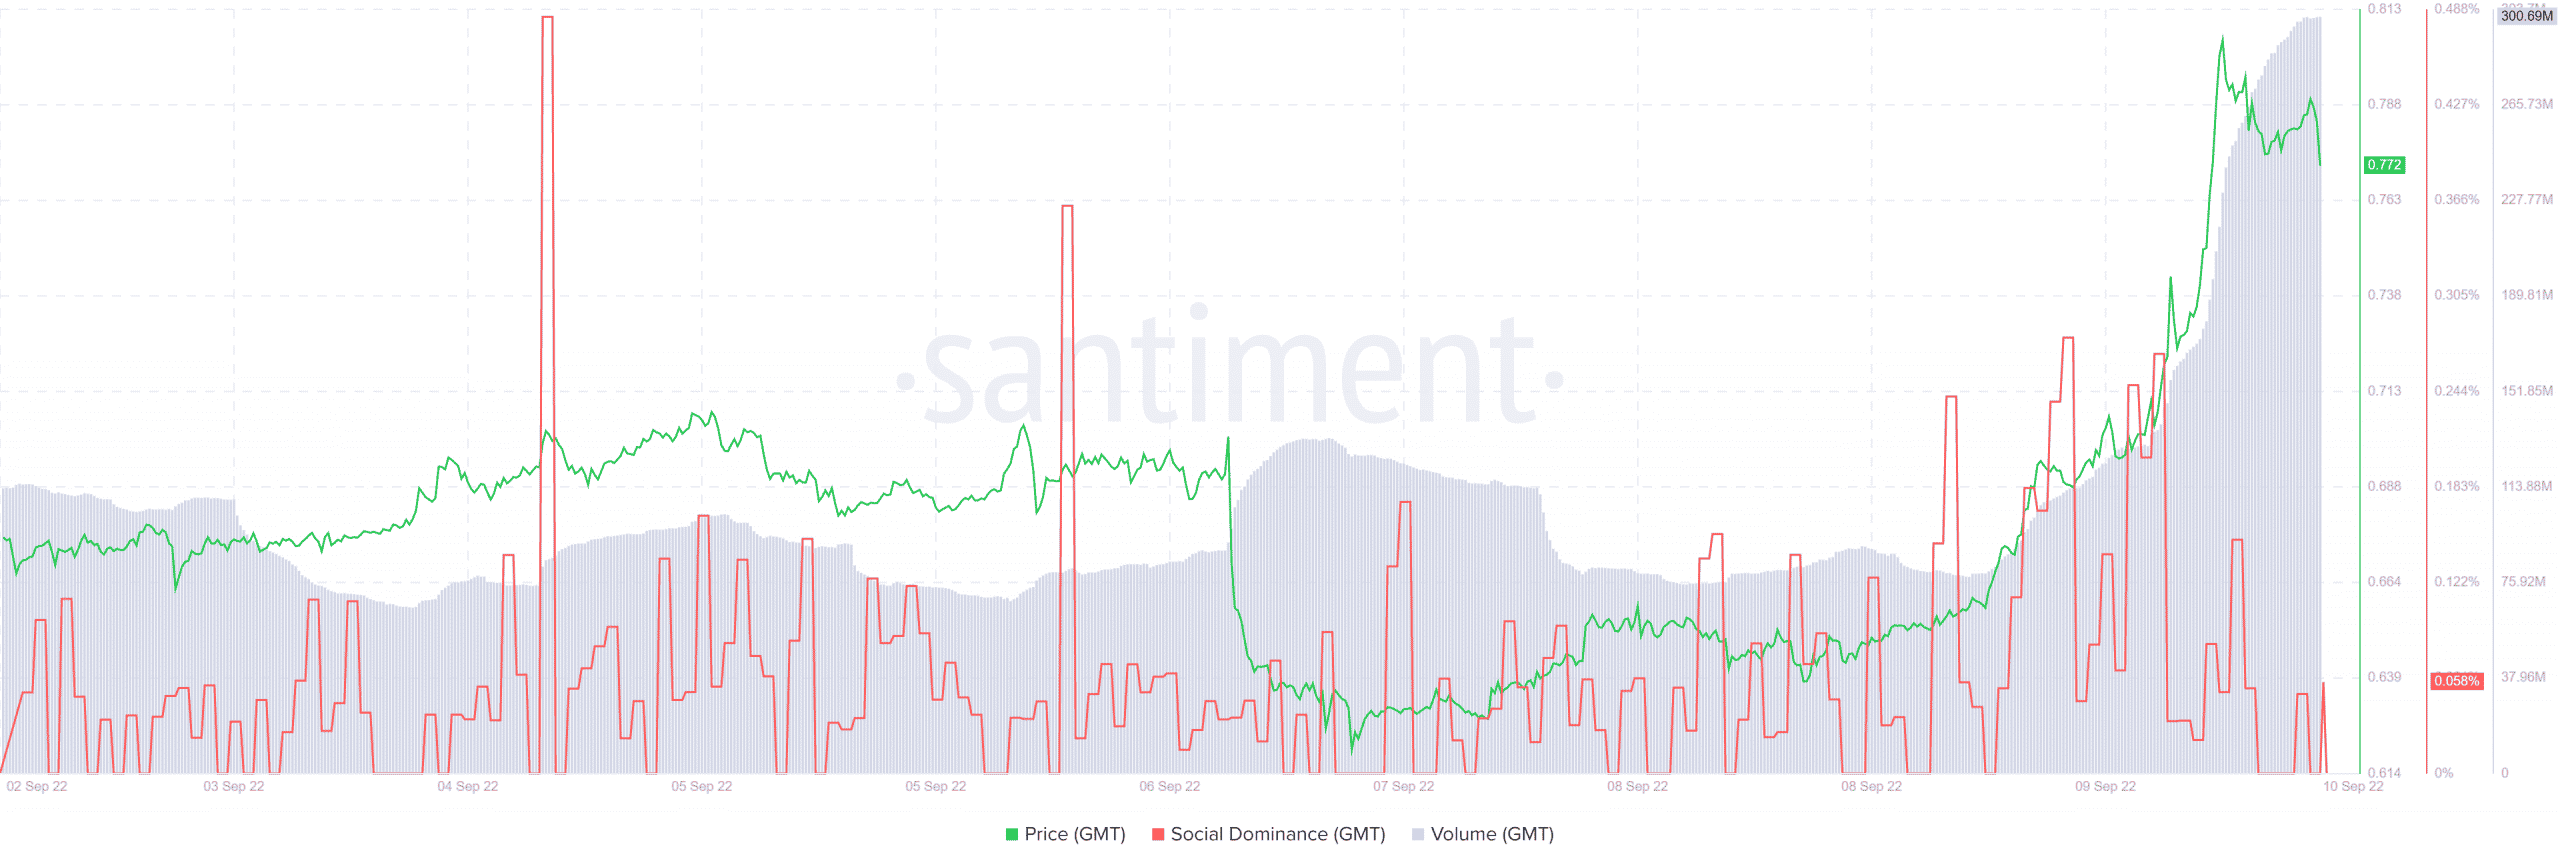
A look into GMT’s metrics gave positive hopes as most of them backed the price surge and indicated a further rise. For instance, GMT’s 30-day Market Value Realized Value (MVRV) Ratio gained upward momentum after declining for quite some time, which is a bullish signal.
Interestingly, the uptick was also backed by high volume, providing additional support to the massive surge.

While GMT’s price was increasing, its social dominance also spiked as the community showed more interest in the token. However, though GMT’s 365-day MVRV Ratio also increased, it was way below the 30-day MVRV Ratio, which might cause hindrance to GMT’s upward movement in the coming days.
Going ahead
GMT’s four-hour chart told a different story, as several market indicators suggested a possible price crunch in the coming days. The Relative Strength Index (RSI) and Chaikin Money Flow (CMF), after increasing considerably over the last two days, have registered a downtrend. This minimizes the chances of a further price surge.
Moreover, the Bollinger Bands (BB) indicated that GMT’s price was in a high volatility zone, indicating that the price might enter a squeezed zone soon.
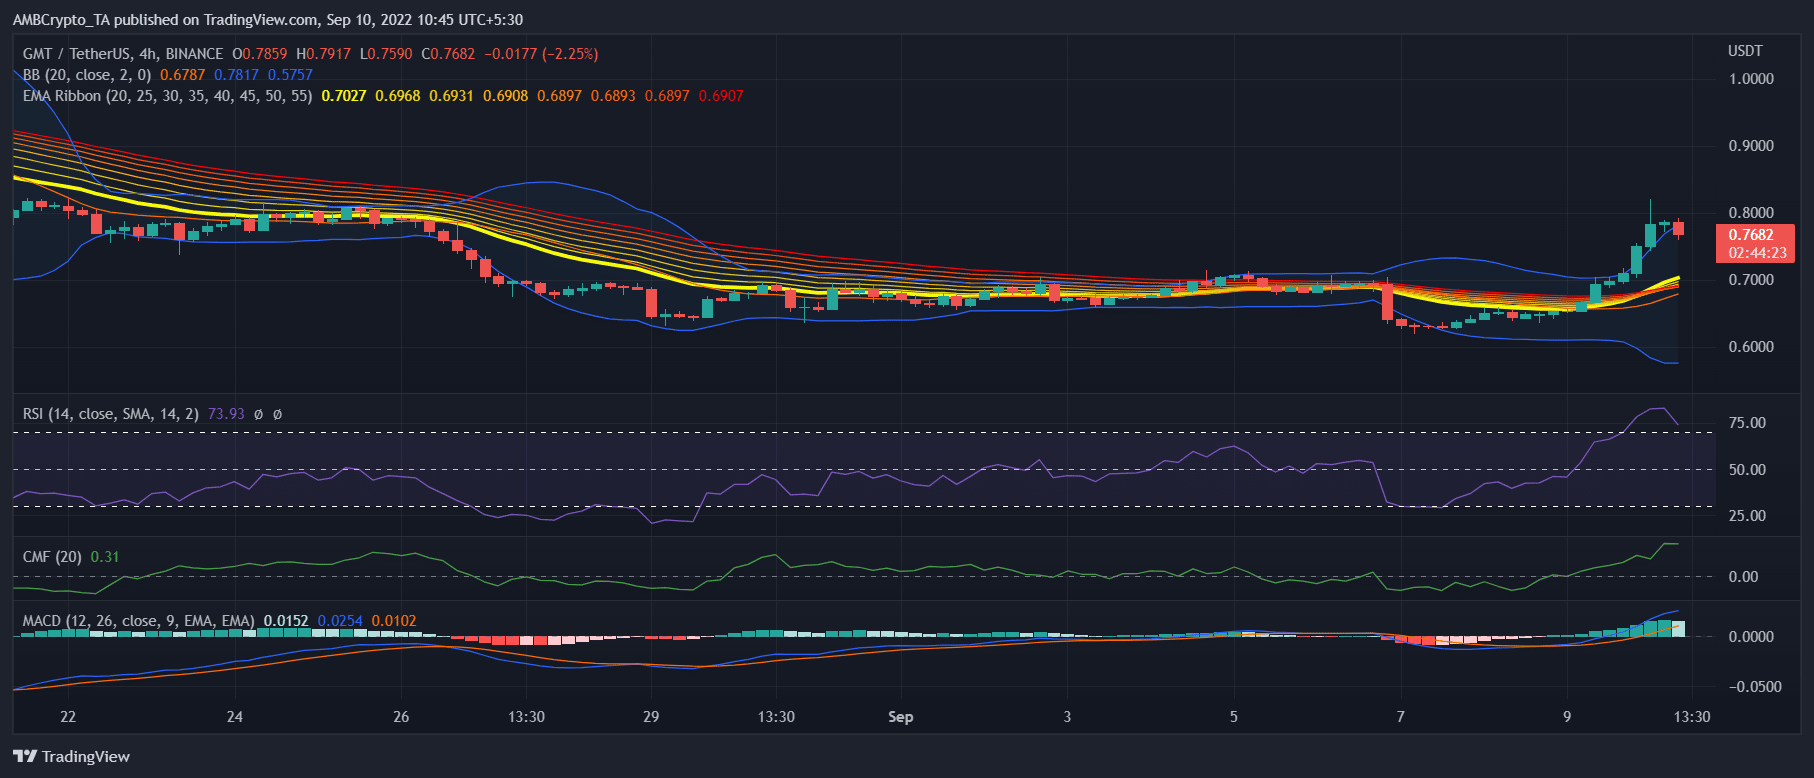
Nonetheless, the Exponential Moving Average (EMA) Ribbon and Moving Average Convergence Divergence (MACD) indicated otherwise. Both the indicators displayed a bullish crossover, which increases the possibility of a further price increase.