Sui coin price prediction: Why $3.2 support is key for a new high
The liquidation heatmap of the past month showed a deep cluster of liquidity at $4 that could attract SUI prices.

- Sui bulls are likely to defend the $3.2 support zone in the event of a retest.
- The liquidation heatmap highlighted two short-term support zones that could be visited before SUI pushes for a new ATH.
Since the first week of August, Sui [SUI] has been trending higher in the 1-day timeframe. The pullbacks it saw on the way, such as the one toward the end of October, were not particularly deep.
The bullish strength of the past few months is set to continue, but short-term price volatility is possible.
SUI consolidates under all-time high
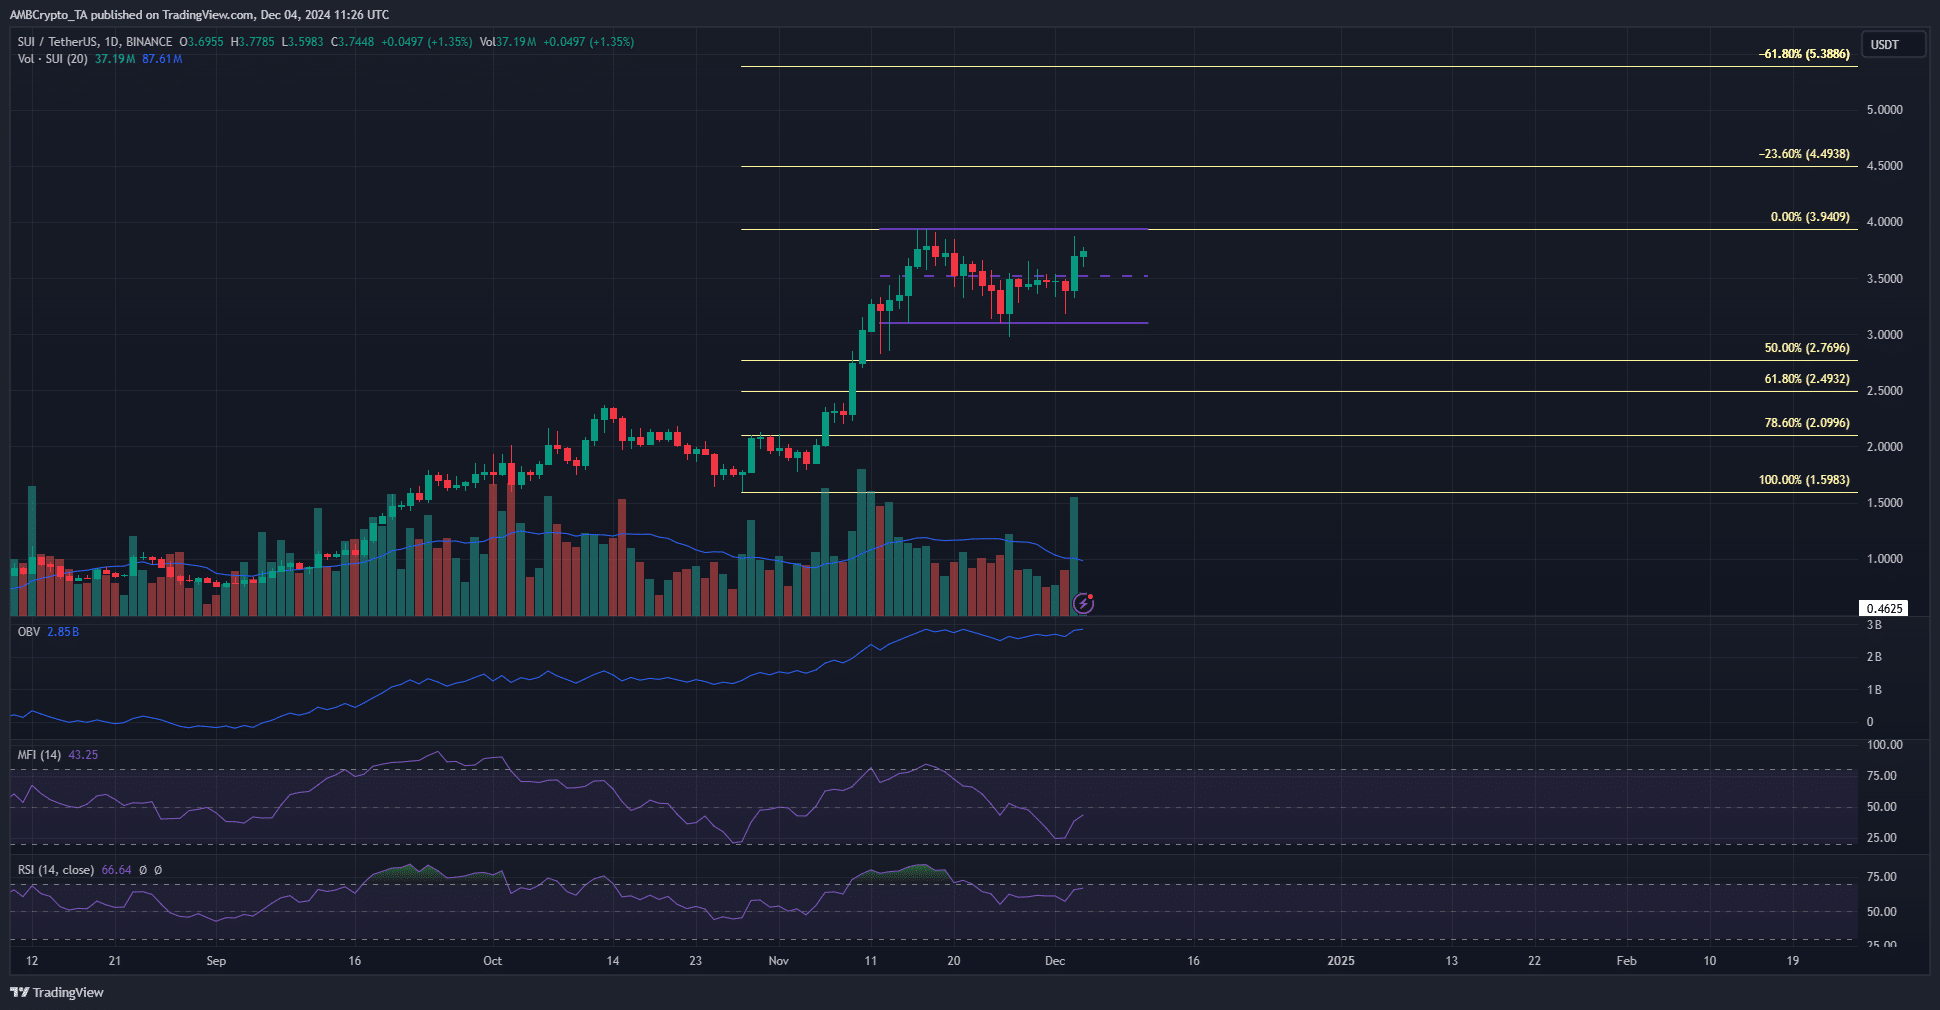
The market structure on the daily chart is still bullish. The two recent higher lows were set at $2.82 and later at $2.97. Hence, a daily session close below $2.97 would be a market structure break, and a deeper drop would indicate growing bearishness.
The RSI was at 60 and remained above neutral 50 over the past four weeks, indicating a bullish trend. This agrees with the bullish price action, although SUI has traded within a range over the past 10 days.
This range extended from $3.1 to $3.94, with the mid-point at $3.52. The mid-point had been resistance in the past few days but was breached, and the bulls targeted the range highs and a new all-time high.
The OBV was in a steady uptrend and showed high buying volume, but the MFT saw a downward move over the past ten days. The consolidation saw the MFI lose strength, but with SUI above $3.52, more gains could be coming.
Spot CVD in support of the MFI misgivings
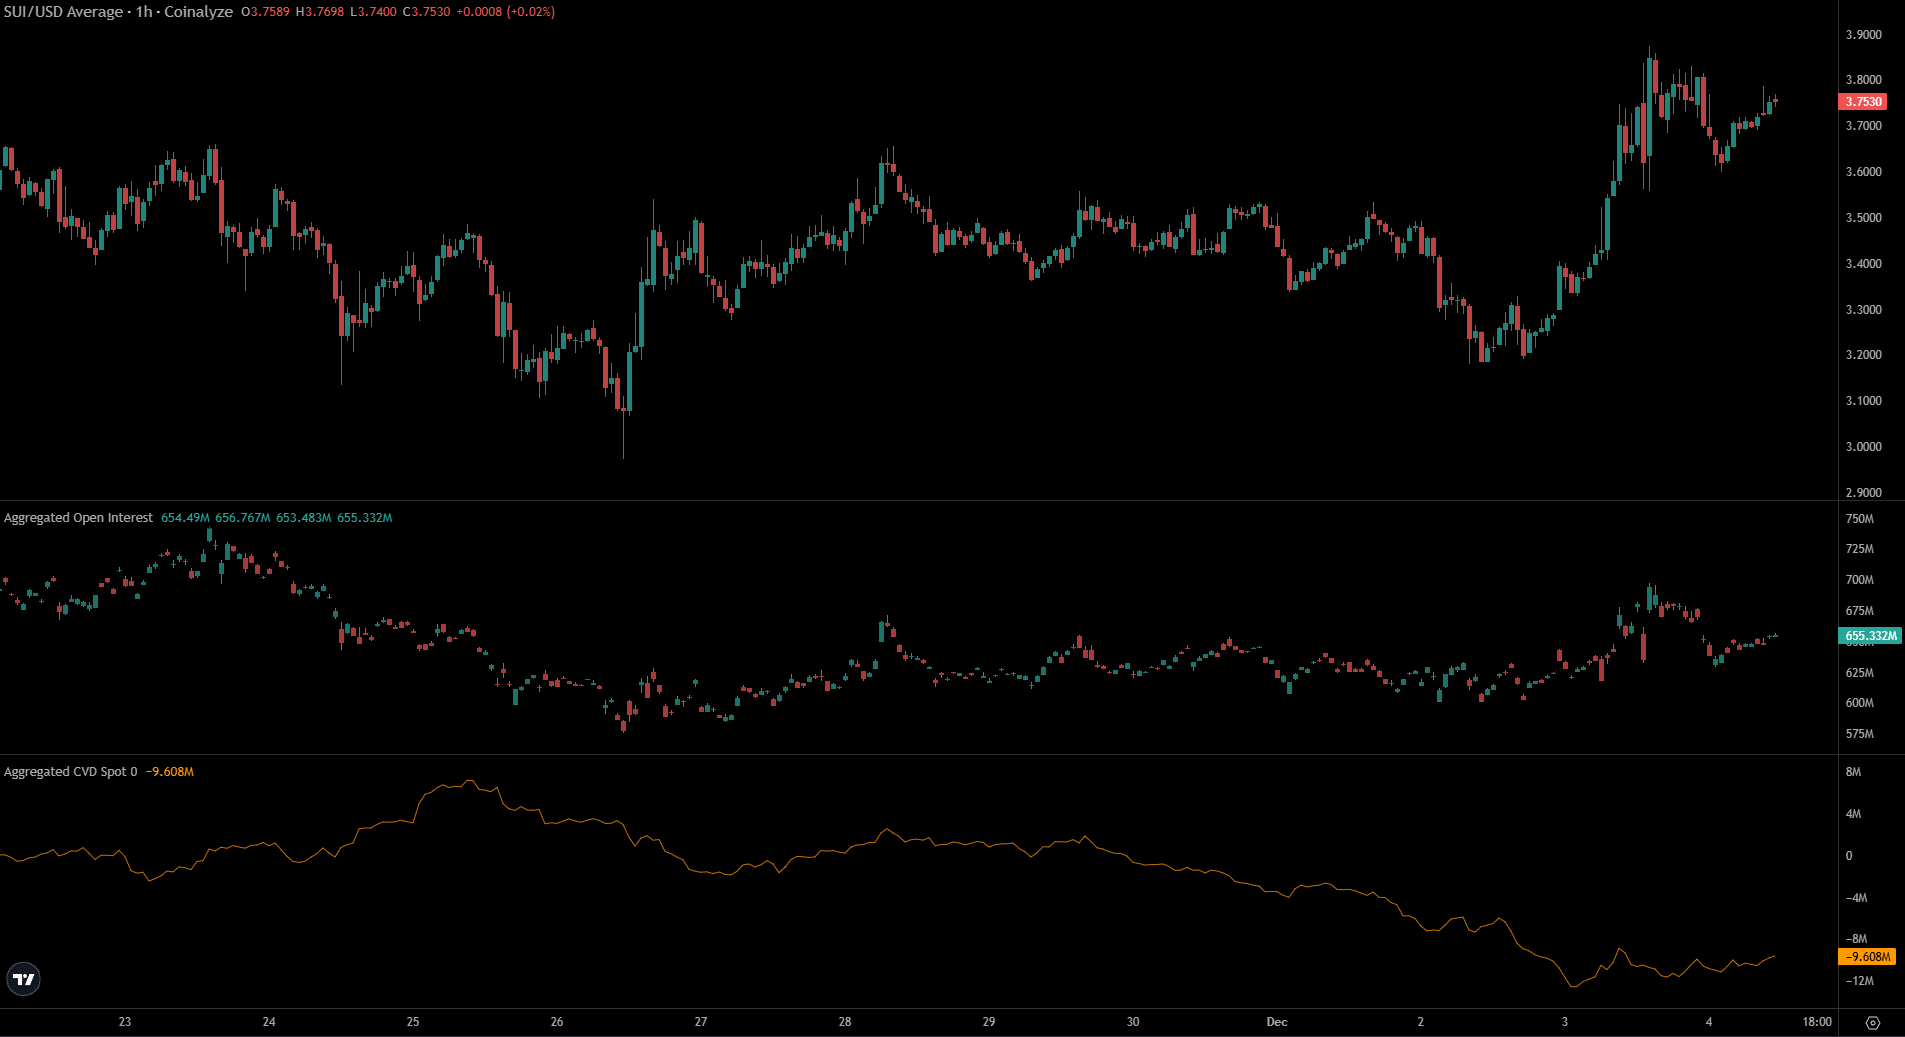
The price of SUI gained rapidly on the 3rd of December, as did the Open Interest. In the past 20 hours, OI has fallen by $45 million, showing some bullish speculators were likely taking profits.
The spot CVD refused to embark on an uptrend, a sign of weak demand in the spot markets. It reinforced the MFI’s findings of a lack of buying and meant that a range breakout could take more time.
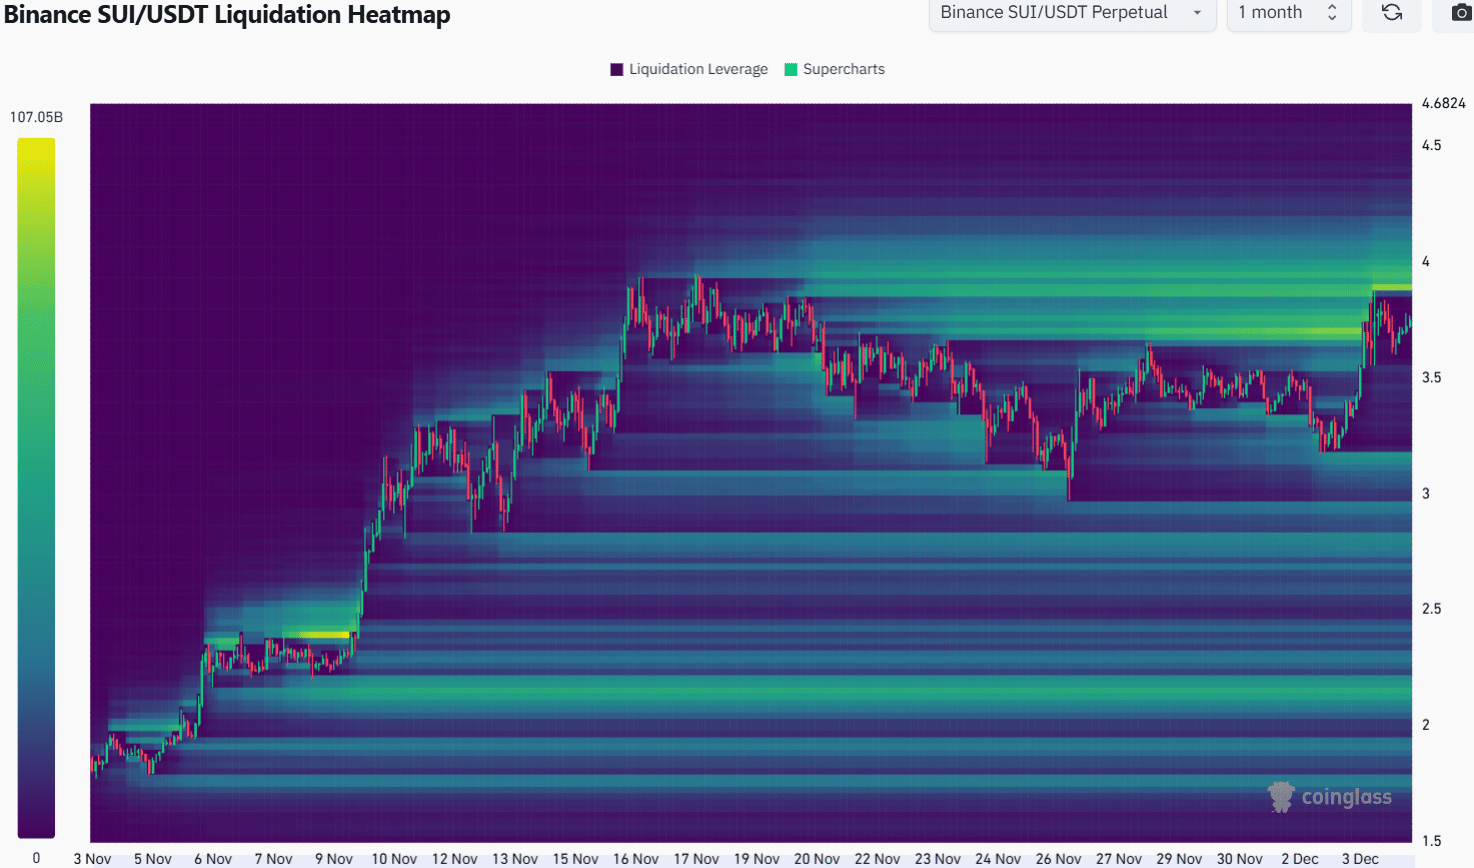
The liquidation heatmap of the past month showed a deep cluster of liquidity at $4. To the south, the next cluster of liquidity was at $3.17, just above the local range lows.
Read Sui’s [SUI] Price Prediction 2024-25
The price may collect the liquidity to the south before zooming higher. Generally, range breakouts see a deviation below key local support levels to flush long liquidation levels before climbing higher.
Traders should be prepared for a price dip toward $3.5 and $3.2 in the coming days.
Disclaimer: The information presented does not constitute financial, investment, trading, or other types of advice and is solely the writer’s opinion