
- SUI’s price increased by more than 20% in the last seven days alone.
- Whale exposure dropped, but most other metrics remained bullish.
SUI has showcased commendable performance last week as it pushed its price in double-digits while most others struggled. But the bears got invited to the market again in the past 24 hours.
Does this mean investors should expect SUI’s bull rally to end in the coming days? Let’s find out.
Bullish pattern on SUI’s chart
CoinMarketCap’s data revealed that SUI investors enjoyed profits last week as the token’s value surged by 18% and reached $0.98. However, the last 24 hours were in the bears’ favor because the token dropped by 2%.
At the time of writing, SUI was trading at $0.9067 with a market capitalization of over $2.4 billion, making it the 31st largest crypto.
However, this latest setback might just be a short dip before a massive rise. AMBCrypto’s analysis of the token’s daily chart revealed that SUI was consolidating inside a bullish symmetrical triangle pattern.
The pattern first emerged in August, and since then the token has been consolidating inside it.
At press time, the token was nearing the end of the pattern, hinting at a bullish breakout. In the event of a breakout, SUI might register 50% growth and reclaim $1.4 in the coming days or weeks.

Source: TradingView
Is a 50% surge inevitable for SUI crypto?
AMBCrypto then checked the token’s on-chain data to see whether they also support the possibility of a bullish breakout in the coming days.
Our analysis of Santiment’s data revealed that, after a sharp rise, SUI’s open interest fell in the past 24 hours along with its price. Generally, a decline in the metric hints at a change in the on-going price trend.
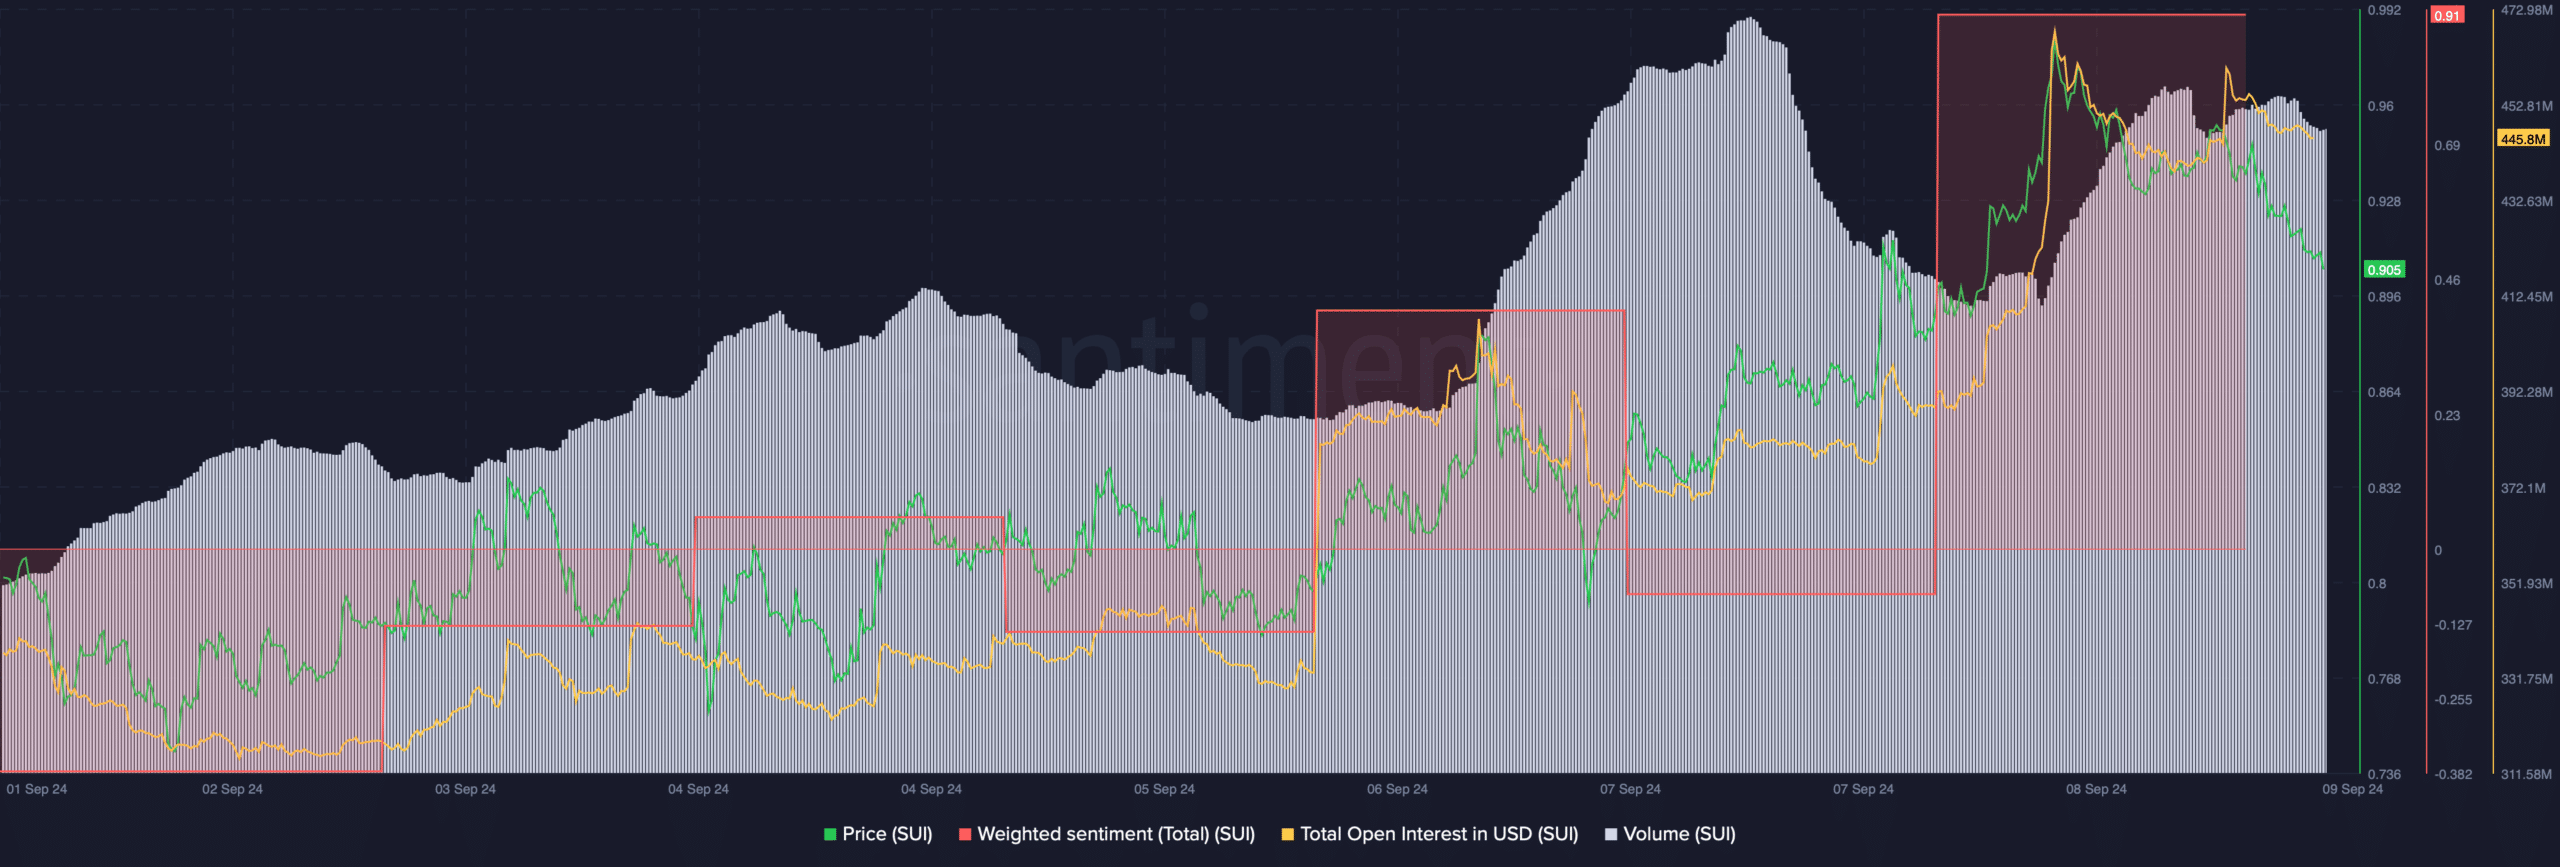
Source: Santiment
The token’s trading volume spiked while its price surged, which acts as a foundation for a bull run. Additionally, the token’s weighted sentiment also increased sharply.
This meant that bullish sentiment around the token was dominant in the market.
However, Hyblock Capital’s data revealed a bearish metric. We found that SUI’s whale vs retail delta dropped from 100 to 9.6, suggesting that whales were having less exposure in the market.

Source: Hyblock Capital
We then assessed the toke’s daily chart. Interestingly, most of the indicators supported the bulls. The token’s price had successfully moved above its 20-day Simple Moving Average (SMA), as per the Bollinger Bands.
Realistic or not, here’s SUI market cap in BTC’s terms
The technical indicator MACD displayed a bullish crossover.
Moreover, the Money Flow Index (MFI) also registered an uptick, suggesting that SUI might successfully break above the bull pattern in the coming days.
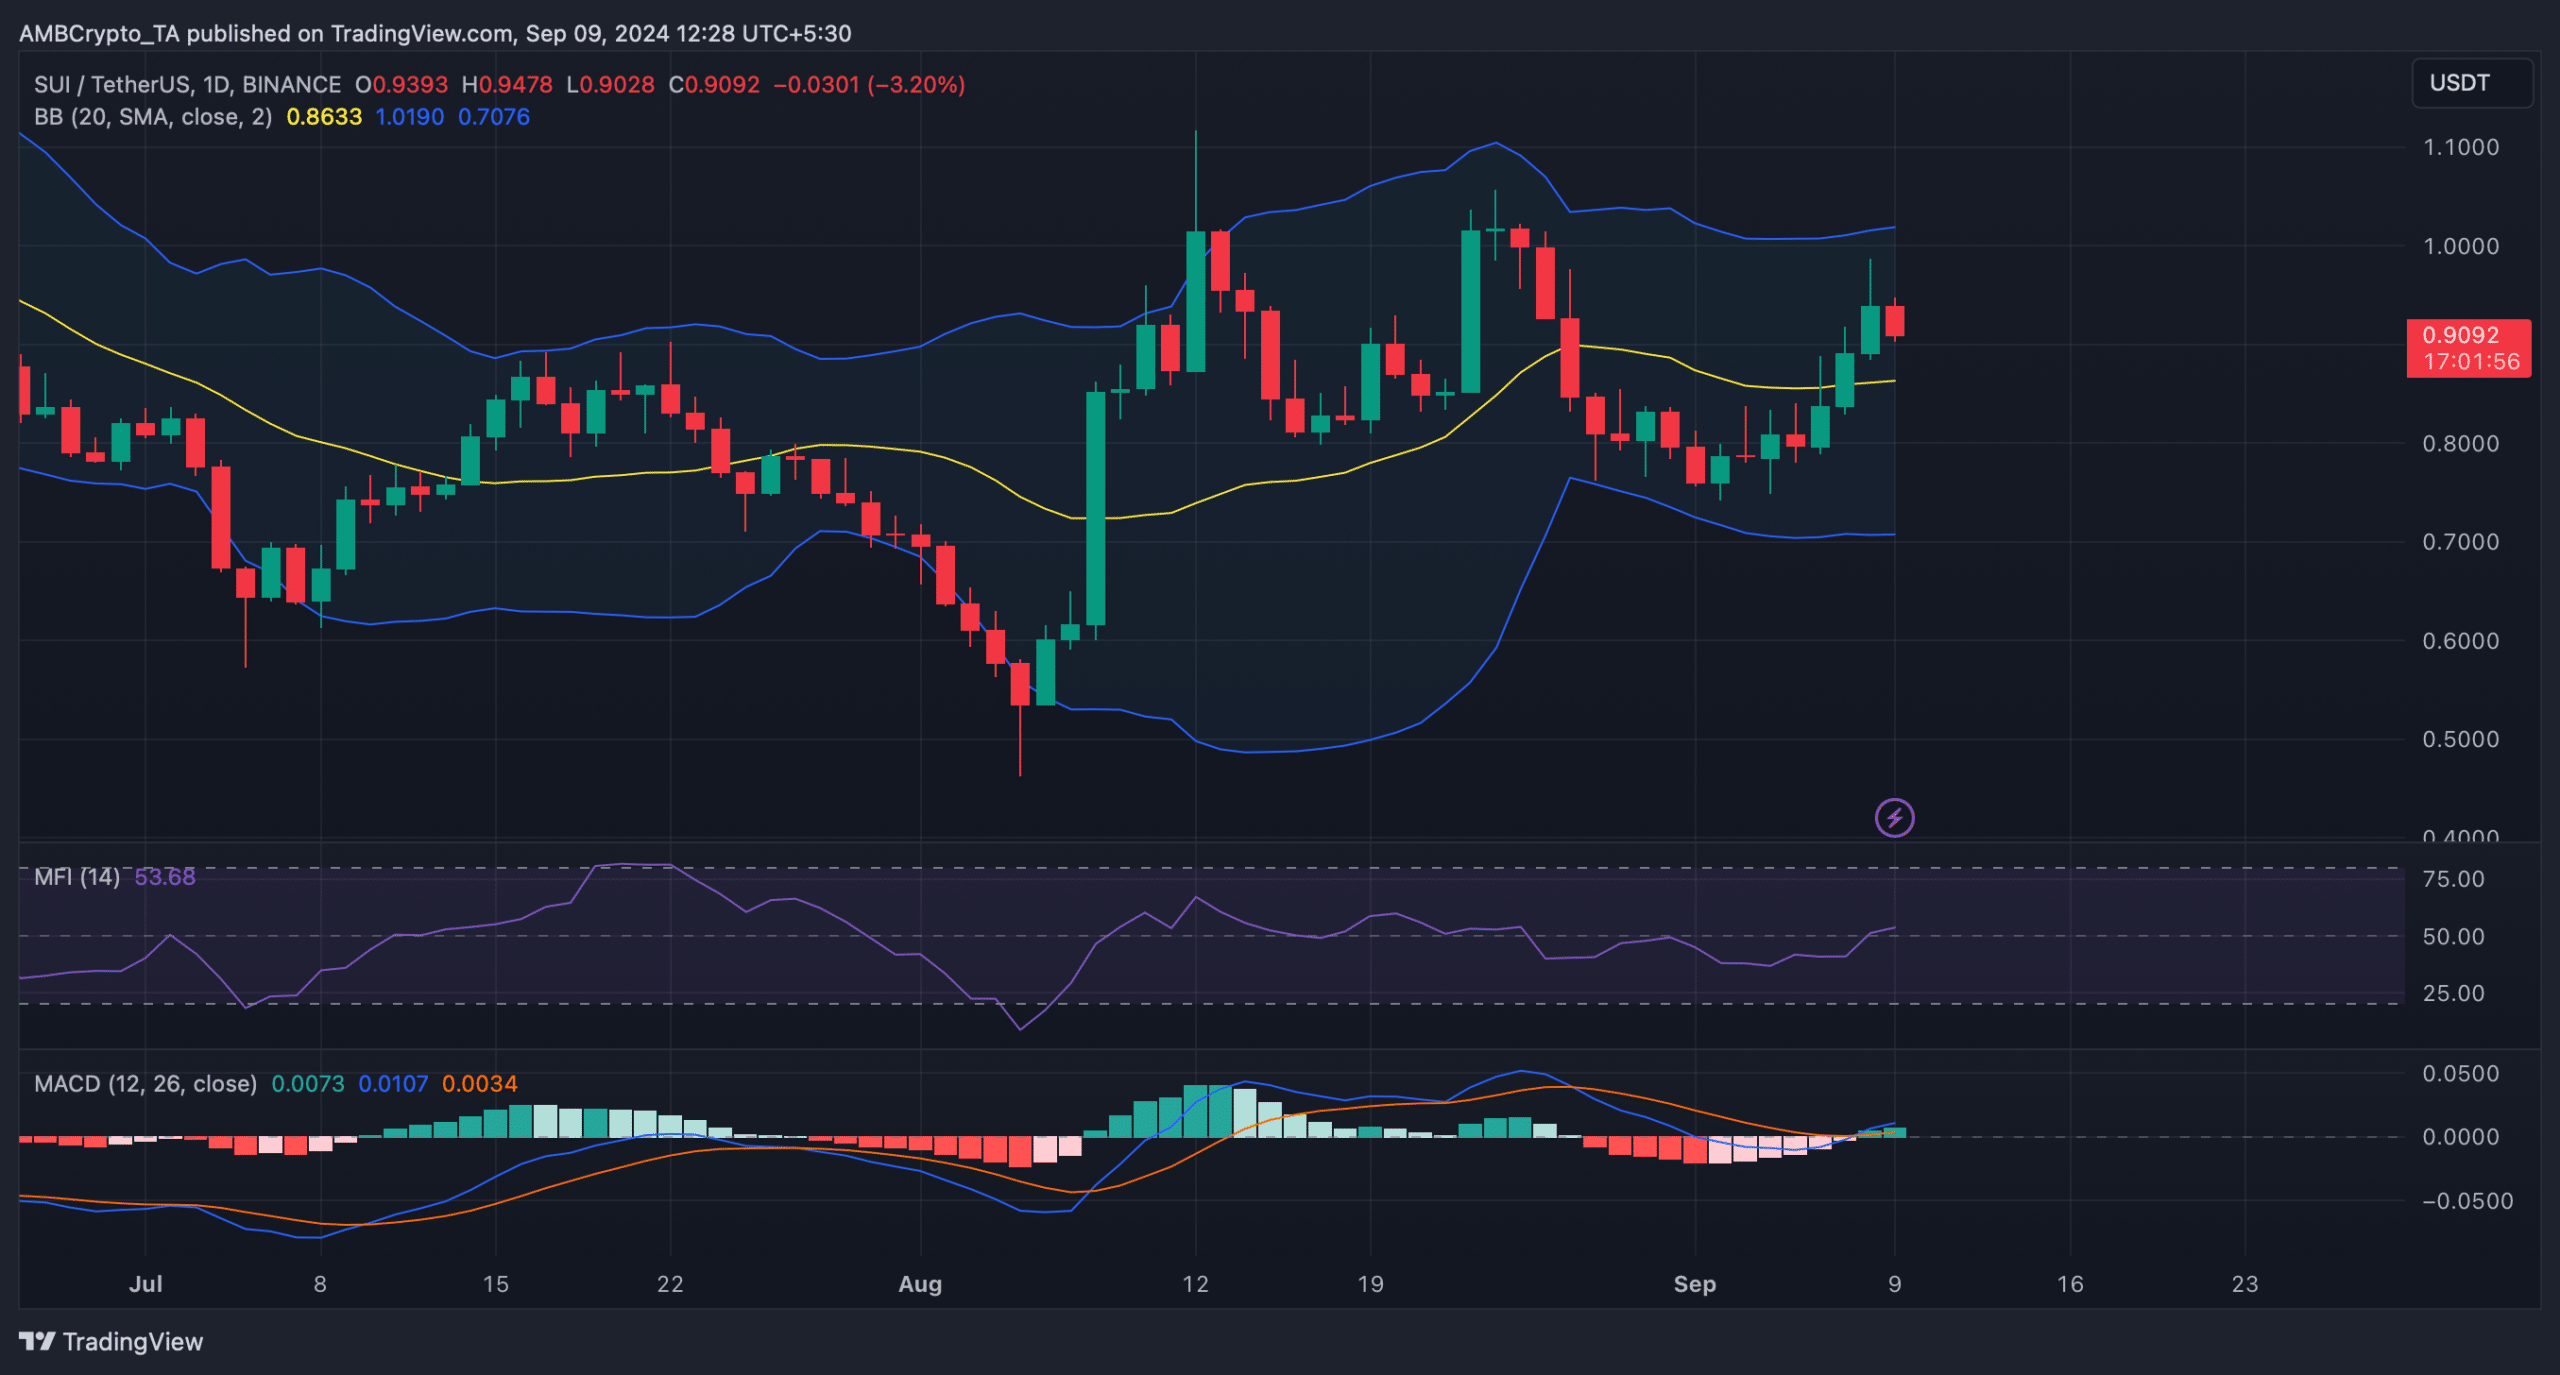
Source: TradingView