SushiSwap [SUSHI], as of 31 October, made it to the list of the top Polygon projects in terms of galaxy score, only behind AAVE. This was a major update for SUSHI that could play in favor of the blockchain in terms of a possible price surge in the coming days. Furthermore, a higher galaxy score could also be considered as a bullish signal.
Top Polygon Projects By Galaxy Score 🔥$AAVE @AaveAave
$SUSHI @SushiSwap
$API3 @API3DAO$PNT @pNetworkDeFi$CRV @CurveFinance$GLCH @glitchprotocol$OCEAN @oceanprotocol$MATH @MathWallet$NSFW @Pleasure_coin$CPOOL @ClearpoolFin@LunarCrush#POLYGON $MATIC pic.twitter.com/T0DioY3Oo1— NFTevening ɢᴍ (@NFTevening) October 30, 2022
______________________________________________________________________________________
Here’s AMBCrypto’s Price Prediction for SushiSwap [SUSHI] for 2023-24
______________________________________________________________________________________
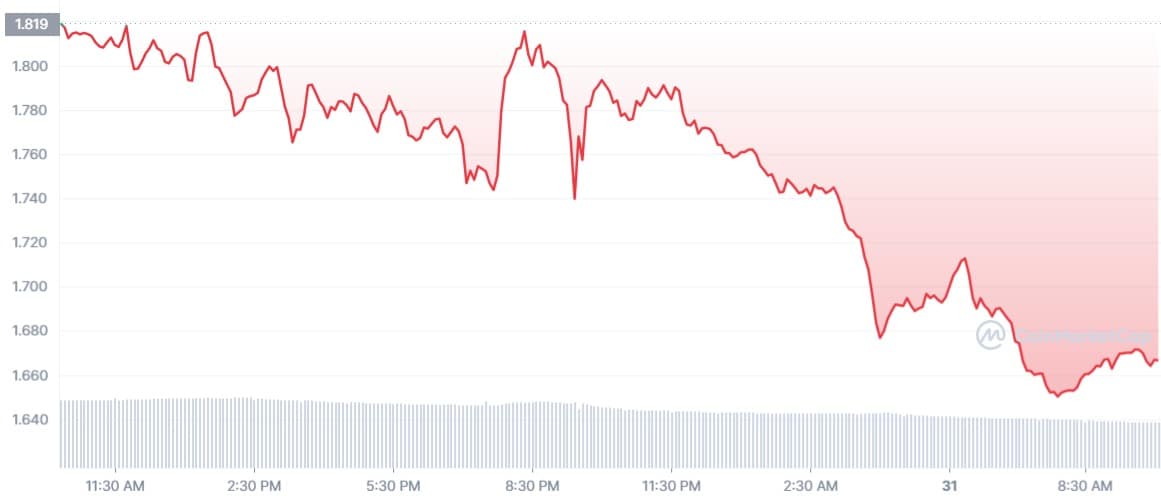
However, contrary to the information presented above, SUSHI‘s 24-hour performance wasn’t quite promising. According to CoinMarketCap, SUSHI was down by more than 9% over the last day and at press time was trading at $1.66. Not only this, but several on-chain metrics also suggested a price decline.
Trouble incoming
SushiSwap recently posted an update regarding the implementation of its Treasury Multisig Signers program. In the new update, SUSHI mentioned all the new signers proposed to sit on the Multisig who were all actively involved in the crypto and Web3 space.
⚡️New Implementation Proposal is up!
Sushi Treasury – Multisig Members Update ✍🏽
📜 Go cast your vote and claim your POAP:https://t.co/VZiG67zTKM
💬 Read the full proposal here:https://t.co/deSvgQ4KbZ
— Sushi.com (@SushiSwap) October 29, 2022
Despite this development, SUSHI seemed unimpressed. CryptoQuant’s data revealed that SUSHI’s exchange netflow total was higher than last week. This was a clear bearish signal as it indicated higher selling pressure. Moreover, the number of active wallets used to send and receive coins decreased by -40.79% compared to 30 October, yet another red flag for SUSHI.
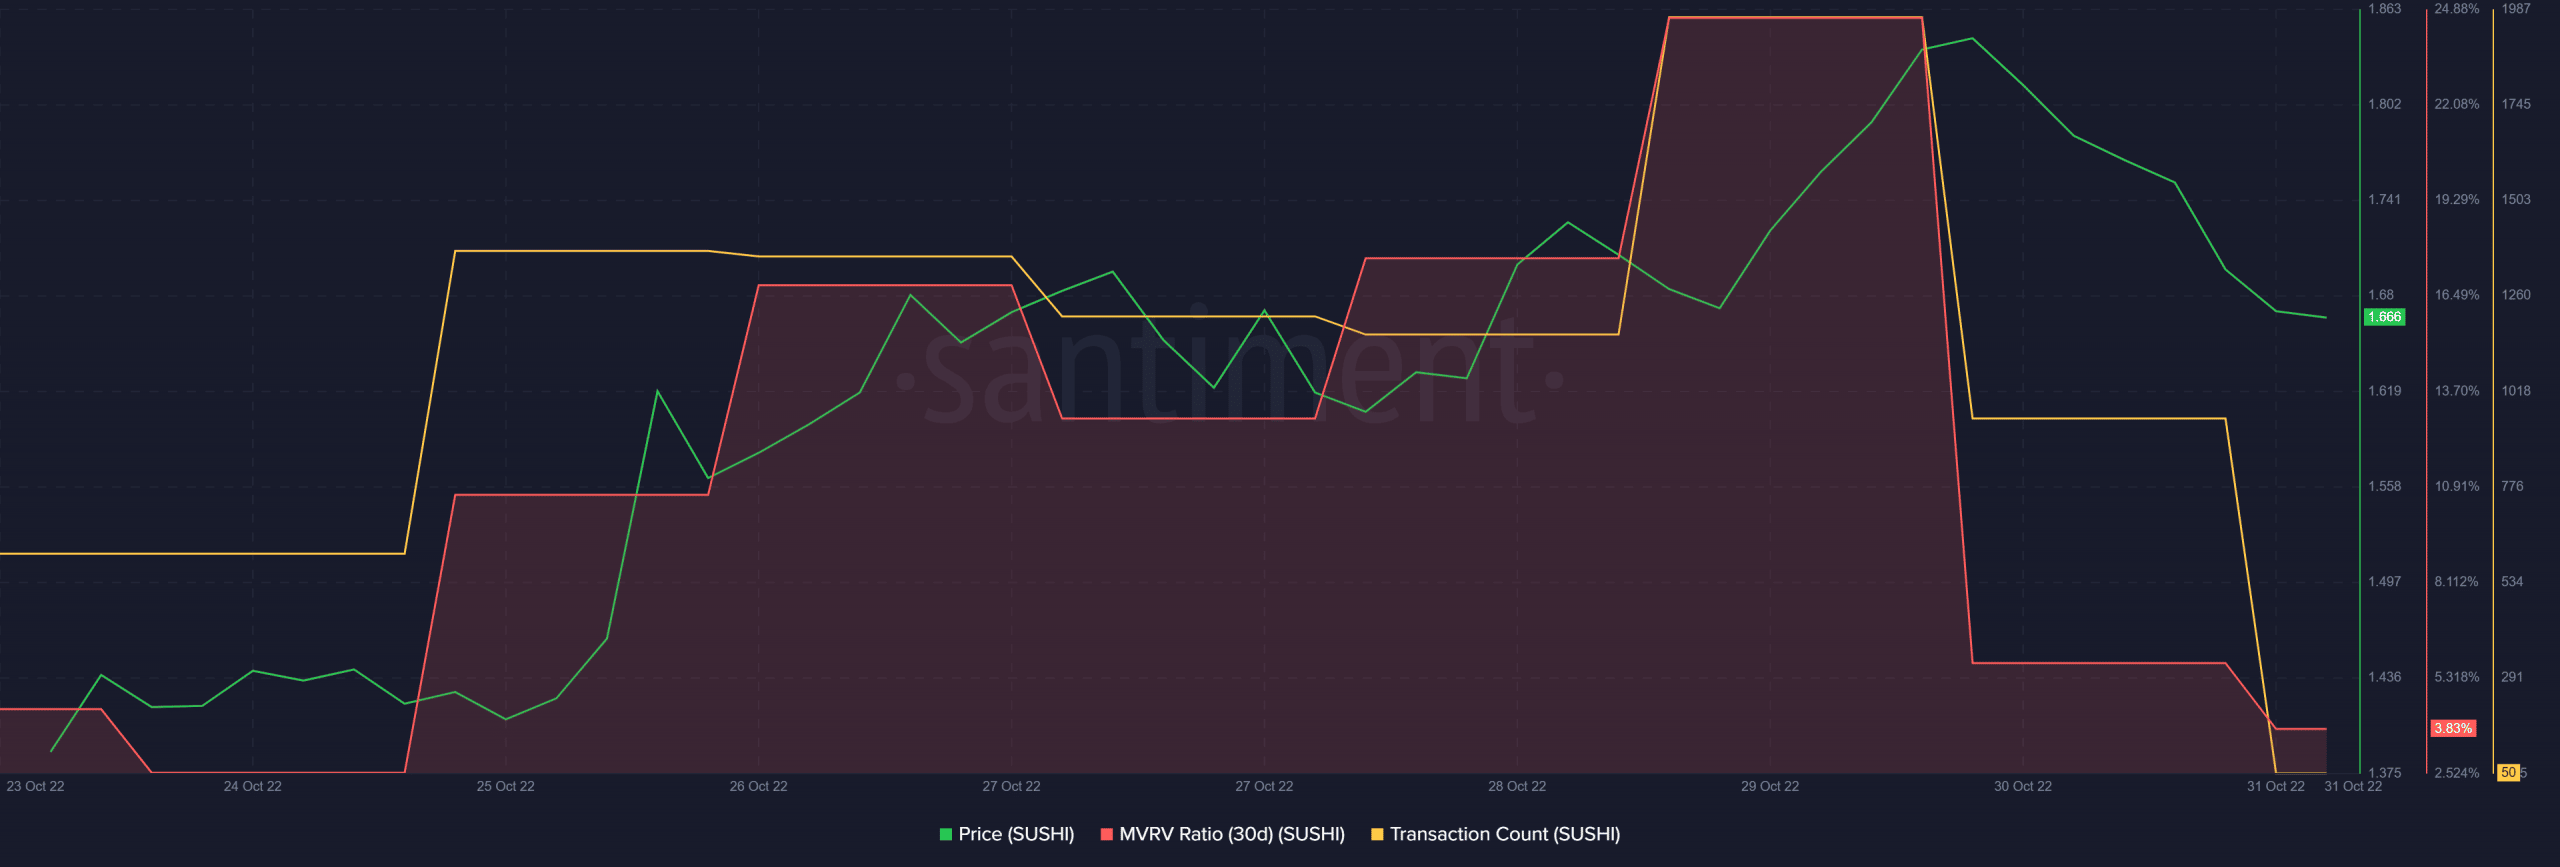
Santiment’s charts also painted a similar bearish picture for SushiSwap. For instance, SUSHI’s Market Value to Realized Value (MVRV) Ratio went down after registering an uptick on 29 October. SUSHI’s transaction count also declined over the last few days, further establishing a bearish edge in the market.
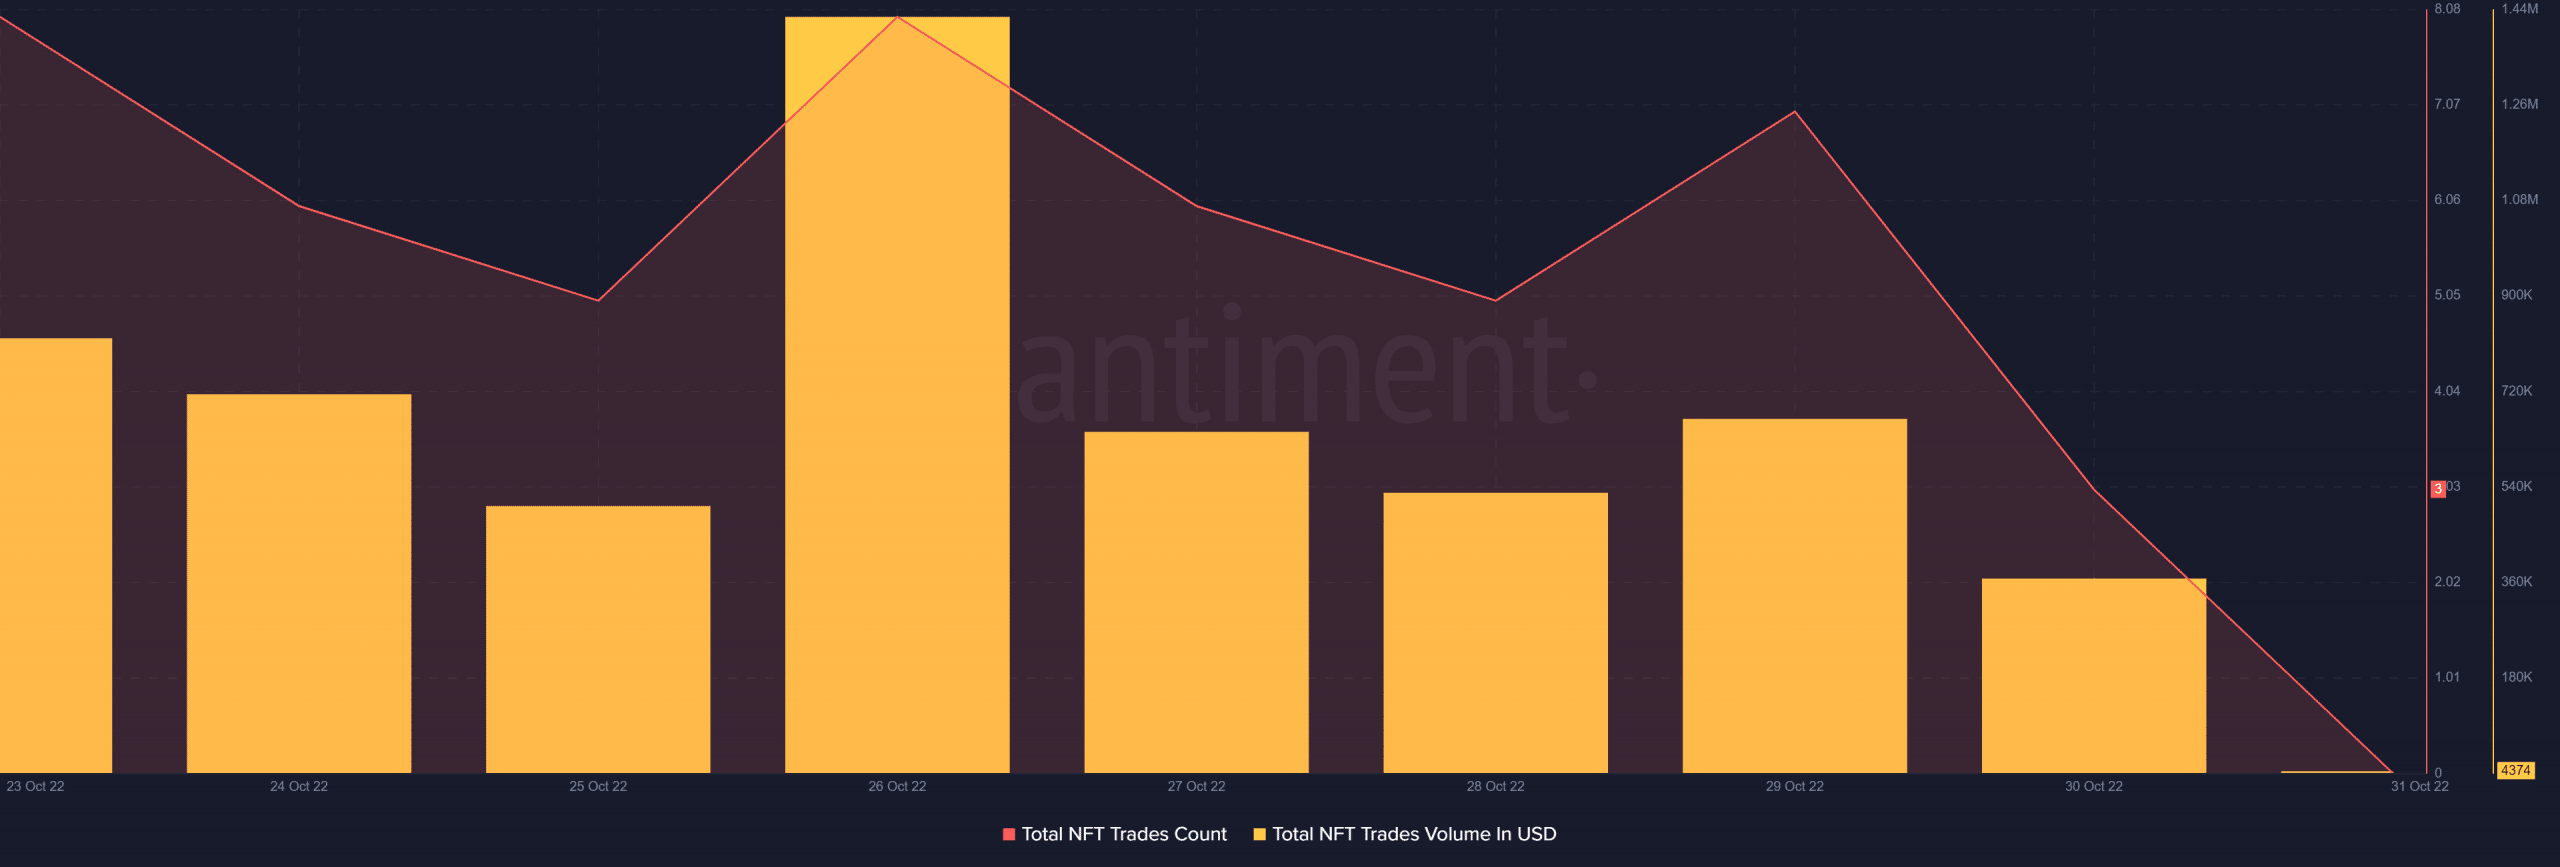
Not only this, but SUSHI’s NFT space also witnessed a decline. The total NFT trade count witnessed a downfall last week. Furthermore, the NFT trade volume in USD, after registering a spike, also went down later in the week.
An ongoing tug-of-war situation
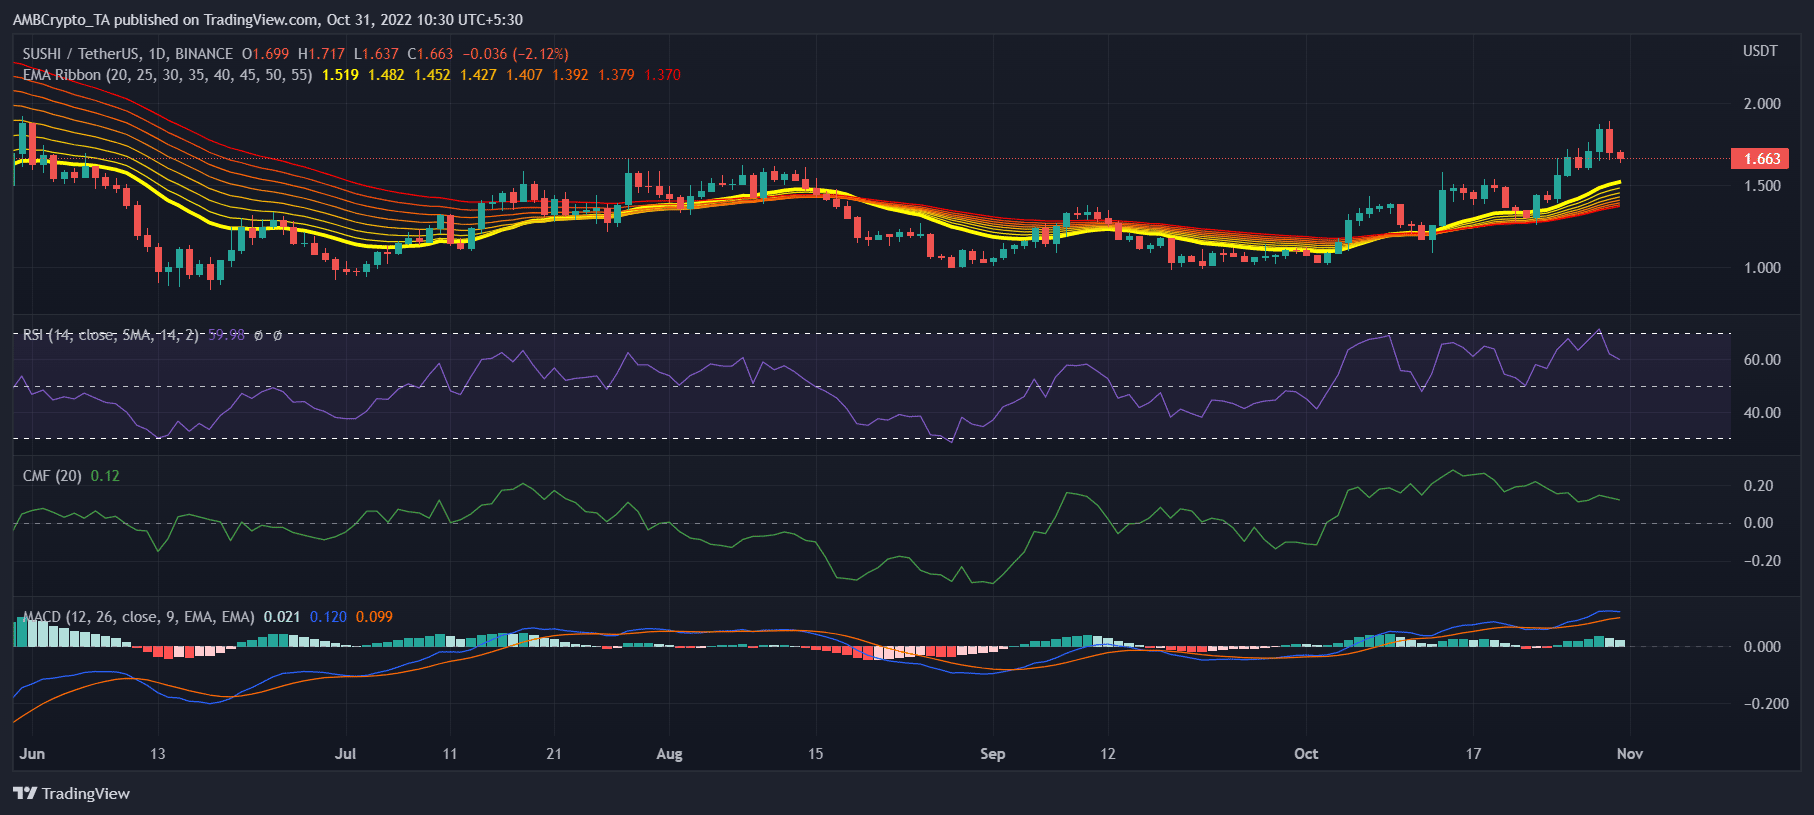
SushiSwap’s daily chart revealed that the bears and the bulls were struggling to beat one another. Market indicators, too presented an ambiguous front. For instance, the Exponential Moving Average (EMA) Ribbon indicated a buyers’ advantage in the market as the 20-day EMA was above the 55-day EMA.
The Moving Average Convergence Divergence (MACD)’s data complemented that of the EMA Ribbon, but it also suggested that things might take a U-turn as it displayed a possibility of a bearish crossover soon. The Relative Strength Index (RSI), after touching the overbought zone, registered a decline, a bearish signal. Moreover, the Chaikin Money Flow (CMF) also marked a downtick, further increasing the chances of a price plummet.