
- TAPSWAP is poised to break above the upper line of its descending triangle.
- If it succeeds and buying pressure climbs, it may extend its rally.
TapSwap [TAPSWAP] is attempting to break out of a descending triangle in an uptrend, suggesting a decline in selling pressure.
When an asset rallies past the upper line of a descending triangle, which forms resistance, it is a bullish signal. It signals that buying pressure is overpowering the selling activity that was previously forming the triangle.
AMBCrypto’s assessments of some of the token’s key technical indicators confirmed the possibility of a break above the upper line of this descending triangle.
The values of the token’s Relative Strength Index (RSI) and Money Flow Index (MFI) showed that TAPSWAP’s current rally is backed by real demand from market participants.
At press time, the token’s RSI and MFI were 60.90 and 62.53 respectively. These values suggested that TAPSWAP traders favored accumulation over profit-taking.
Further, readings from TAPSWAP’s Directional Movement Index (DMI) affirmed the position above. The positive directional index (green) rested above the negative index (red) at press time.
When these lines are set up in this manner, it suggests that recent price movements have been predominantly upward. This indicates that bulls might be in control, potentially pushing the price higher.
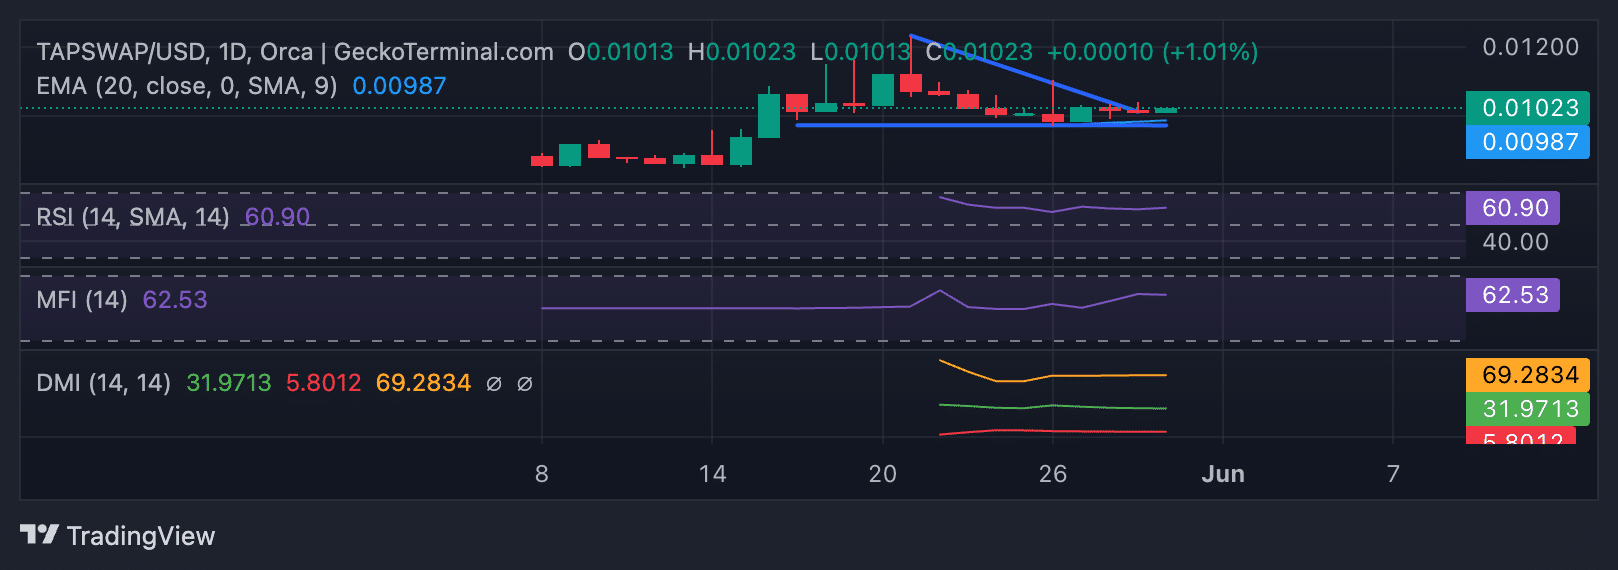
Source: TapSwap/USD on GeckoTerminal
TAPSWAP price prediction shows bears are around
While TAPSWAP’s recent gains are backed by proper demand, bearish sentiment abounds in its market. A look at its Chaikin Money Flow (CMF) showed that it remained negative. At press time, this indicator’s value was -0.37.
Is your portfolio green? Check the TapSwap Profit Calculator
An asset’s CMF measures how money flows into and out of its market. When it returns a value below zero, it signals market weakness as token traders take out liquidity.
The dots of TAPSWAP’s Parabolic SAR indicator were above their price at press time, confirming the presence of the bears. Traders use this indicator to identify potential trend direction and reversals in an asset’s price.
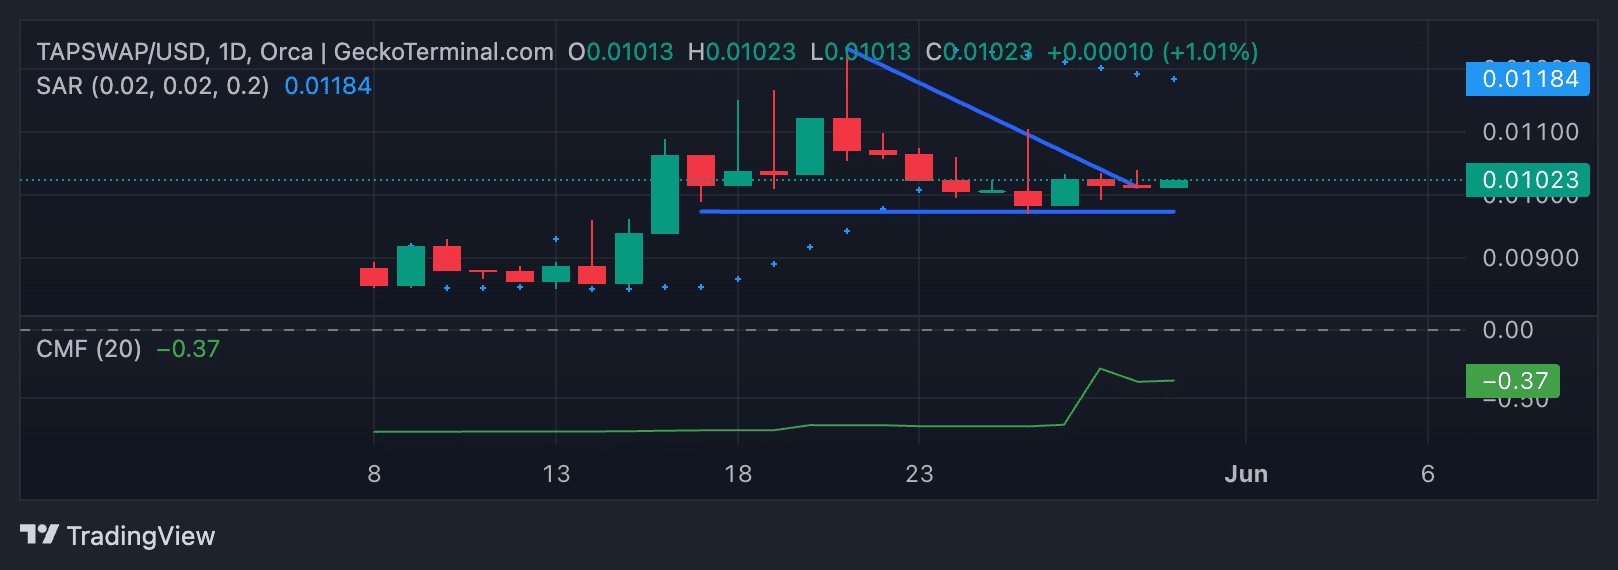
Source: TapSwap/USD on GeckoTerminal
When its dots are above the asset’s price, the bears are deemed to be in control.


![Shiba Inu [SHIB] price prediction - Mapping short-term targets as selling pressure climbs](https://ambcrypto.com/wp-content/uploads/2025/03/SHIB-1-2-400x240.webp)