- TRB’s value has risen by 20% in the last 24 hours.
- Its key momentum indicators suggest that the altcoin continues to enjoy a high demand.
Tellor [TRB], a decentralized oracle protocol, has extended its 30-day gains to rally by an additional 20% in the past 24 hours, as shown by data from CoinMarketCap.
Despite significant bearish sentiment, the altcoin has bucked the general market trend to record a rally in the last month.
According to CoinGecko’s data, global cryptocurrency market capitalization declined by 15% within that period due to low trading activity.
However, TRB’s value rose by 32% during that period, causing it to exchange its hands at $114.60 at the time of writing.
TRB has places to be
An assessment of TRB’s price movements on a 1-day chart confirmed the high demand for the altcoin by market participants. Its key momentum returned high values at the time of press.
For example, the token’s Relative Strength Index (RSI) was 75.96, while its Money Flow Index (MFI) was 91.75.
At these values, these indicators showed that market participants favored TRB accumulation over its distribution.
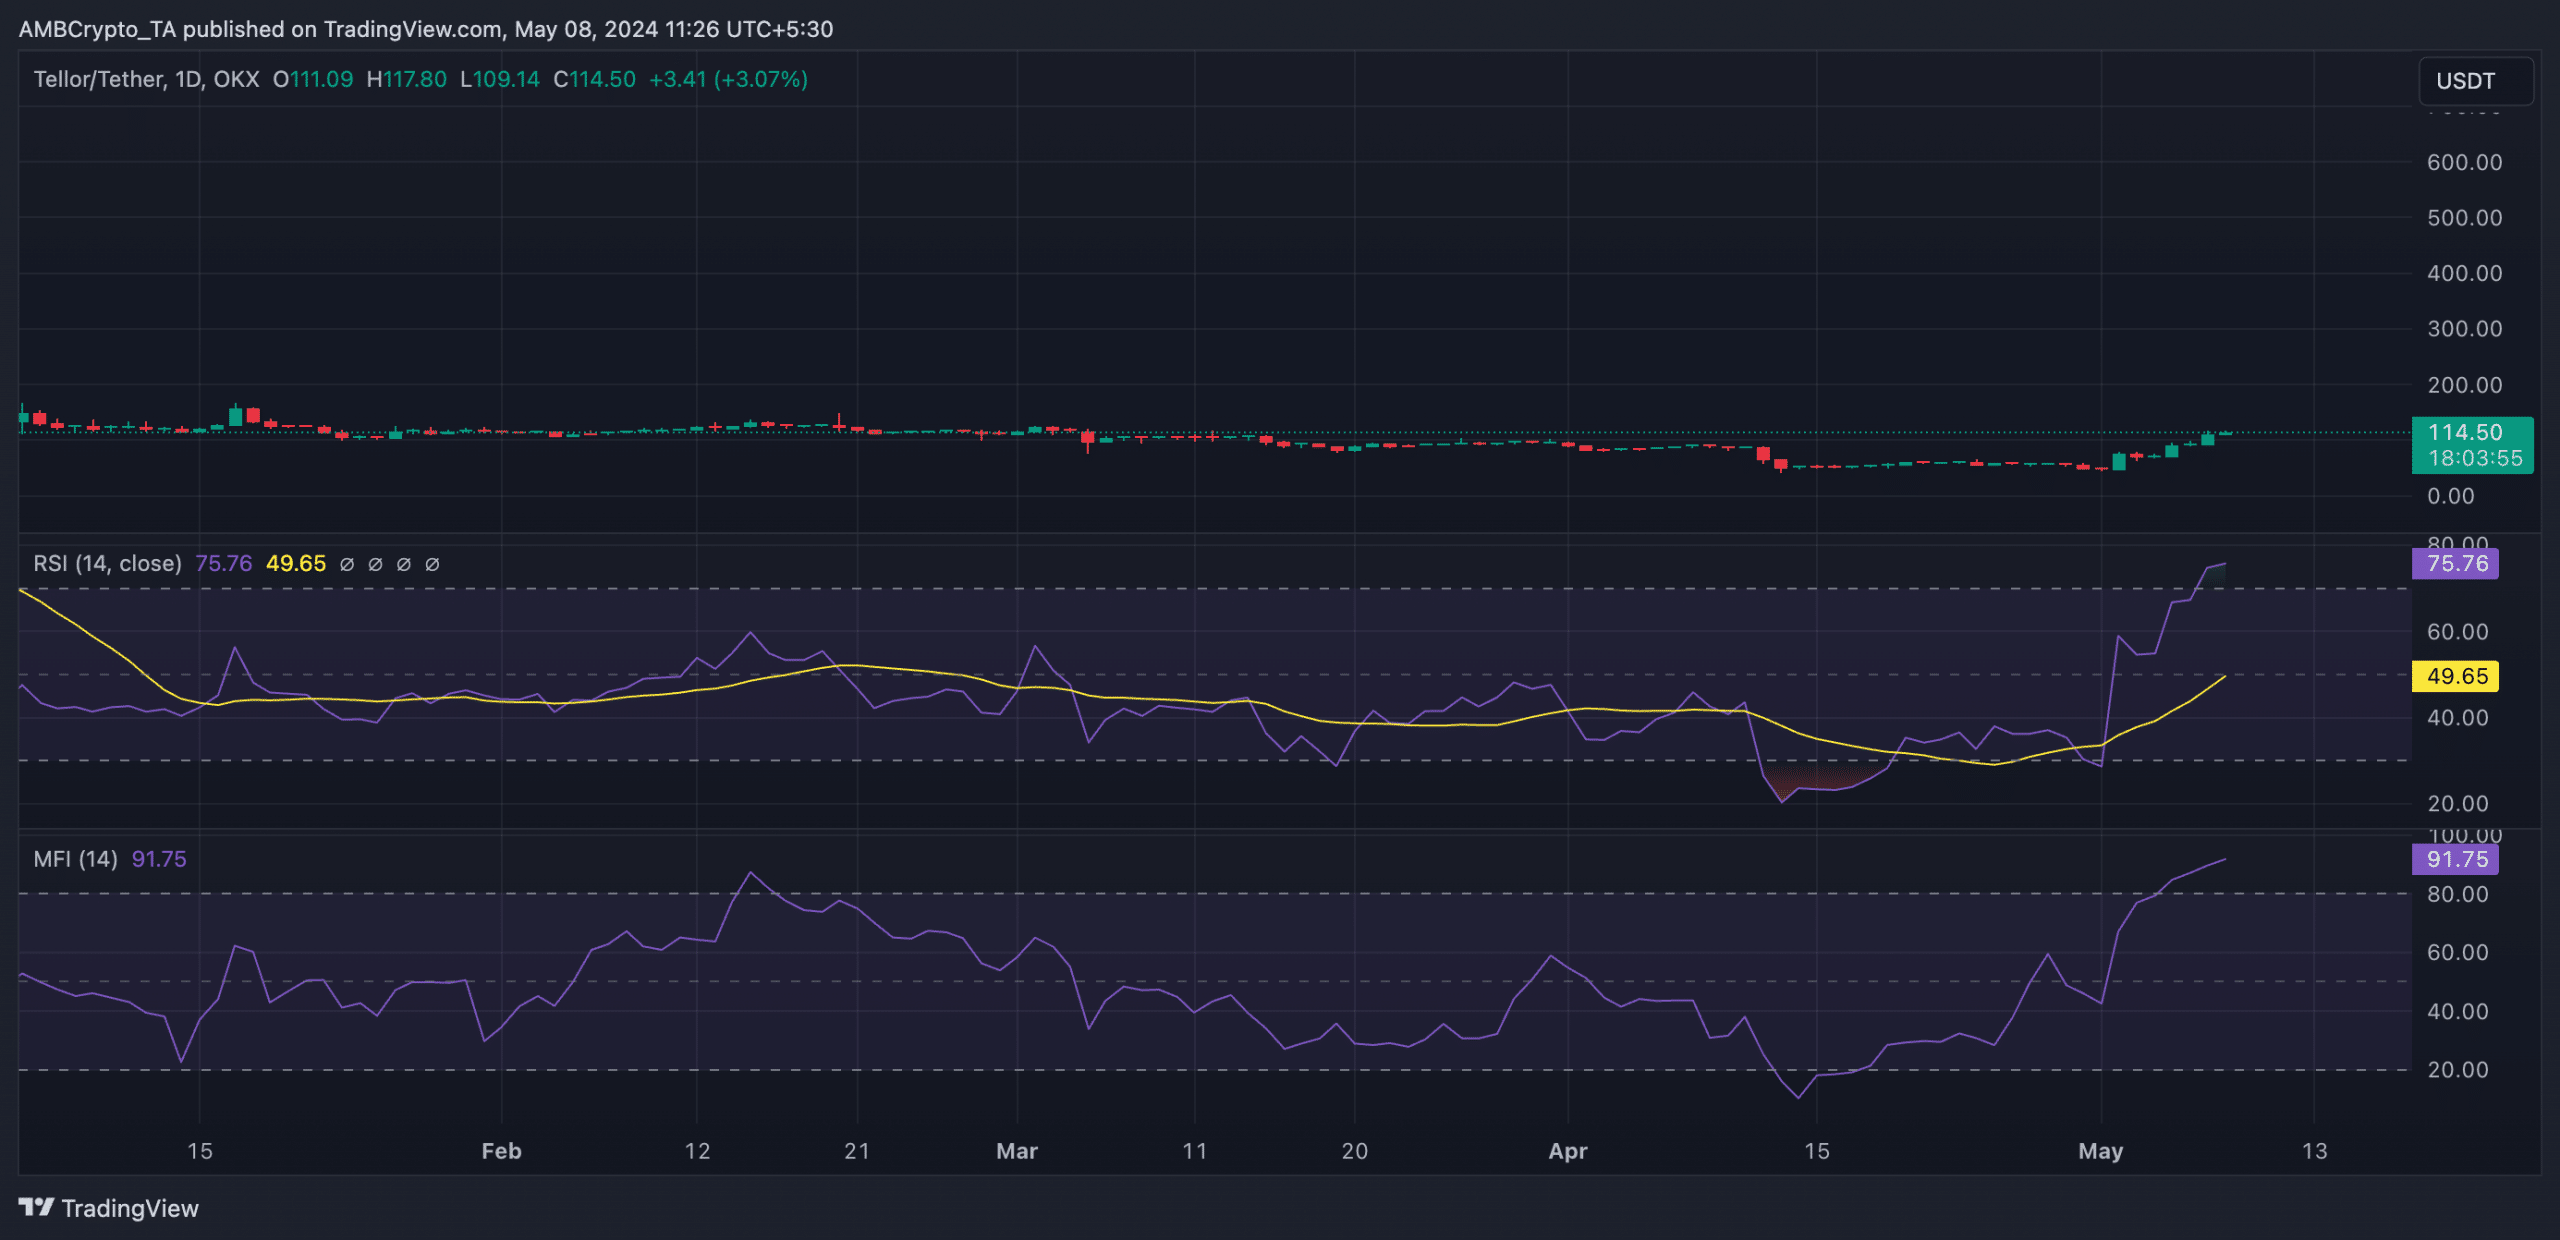
Source: TRB/USDT on TradingView
However, it is pertinent to note that the values of these indicators suggested that the altcoin may be overbought. At these levels, the market is deemed to be overheated, and price correction is usually common.
Confirming the hike in TRB demand, an on-chain assessment of the token’s network activity showed that the count of its daily active addresses has increased by 29% in the last month.
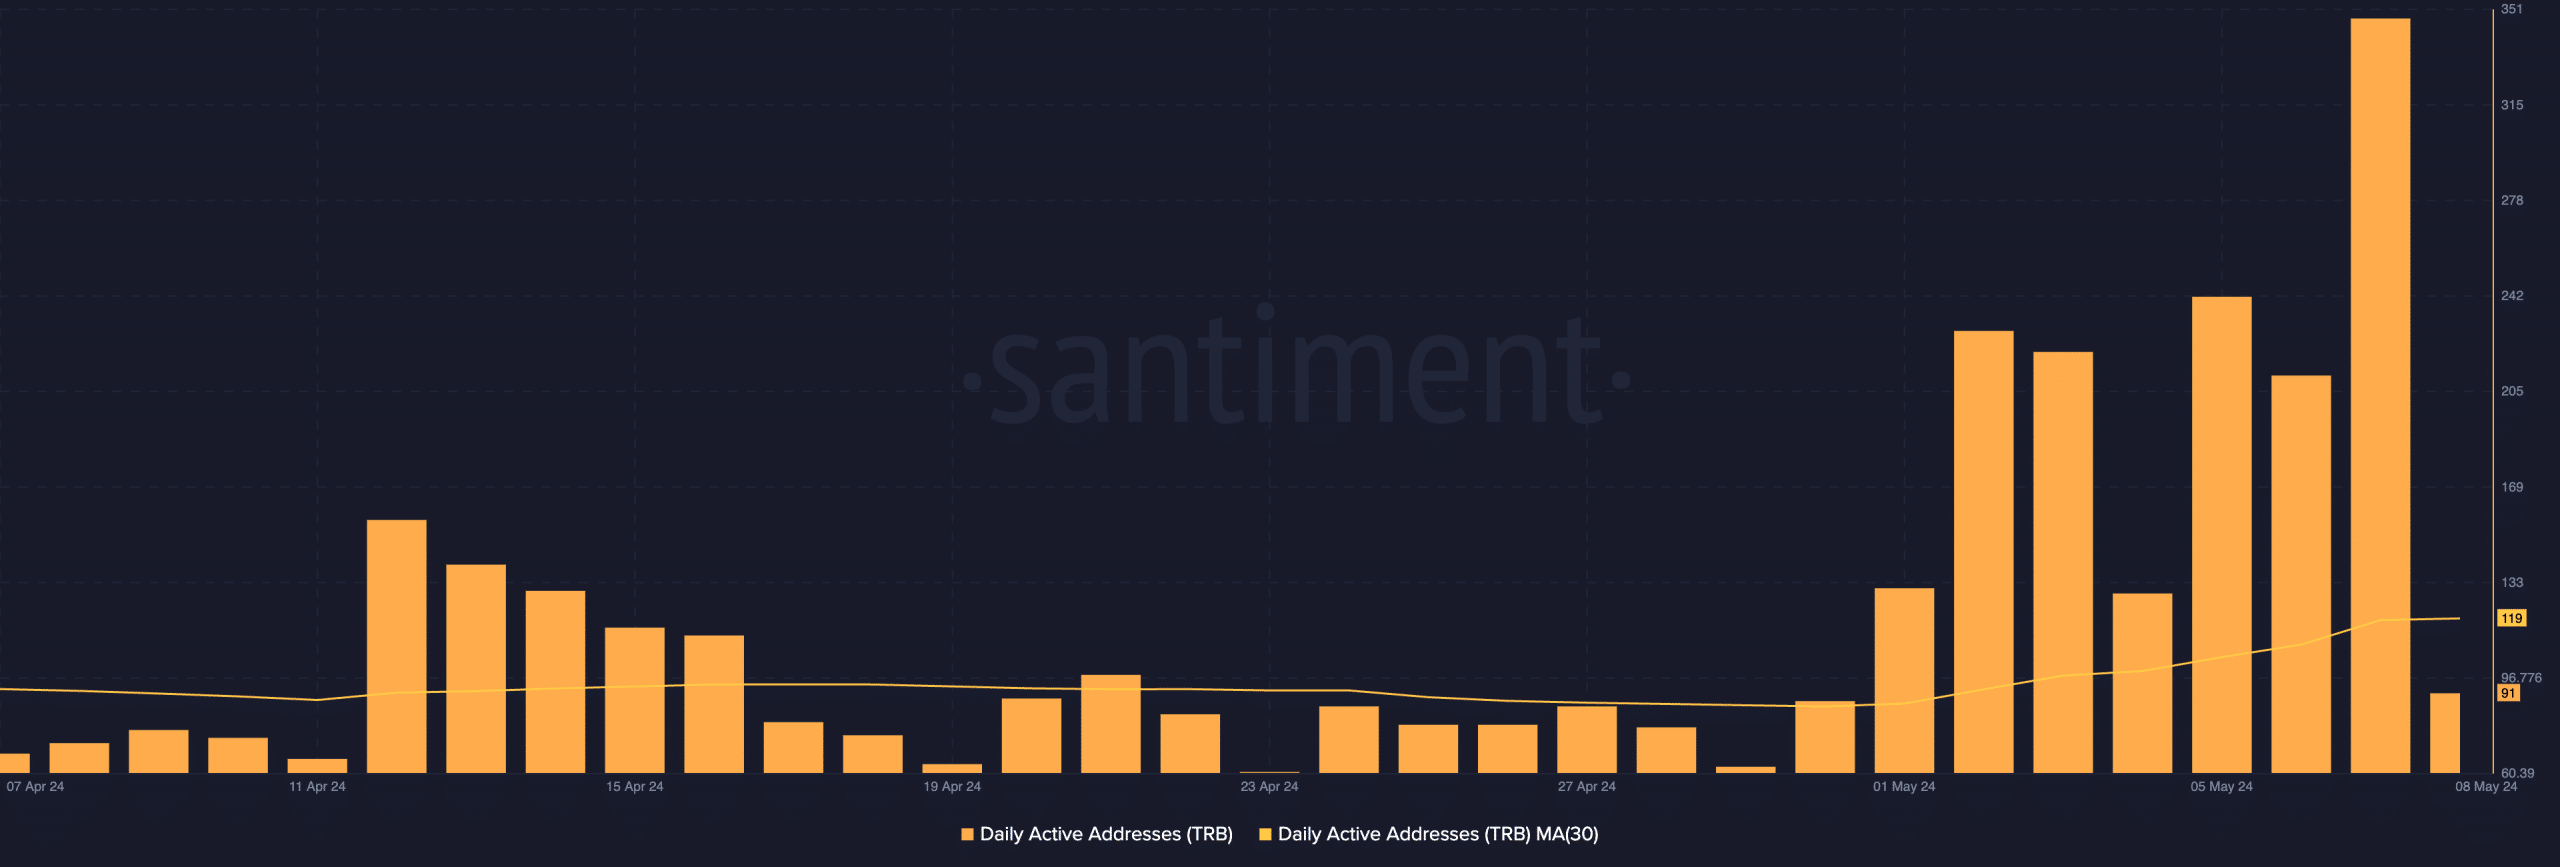
Source: Santiment
While other crypto assets languish under a bearish influence, readings from the TRB market showed significant bullish presence at press time.
The token’s Weighted Sentiment was at a high of 6.98 as of this writing, confirming that the bulls have significant control, according to Santiment’s data.
On the price charts, the dots that make up TRB’s Parabolic SAR rest under its price. This indicator identifies potential trend direction and reversals.
When its dotted lines are placed under an asset’s price, the market is said to be in an uptrend. It indicates that the asset’s price has been rising and may continue.
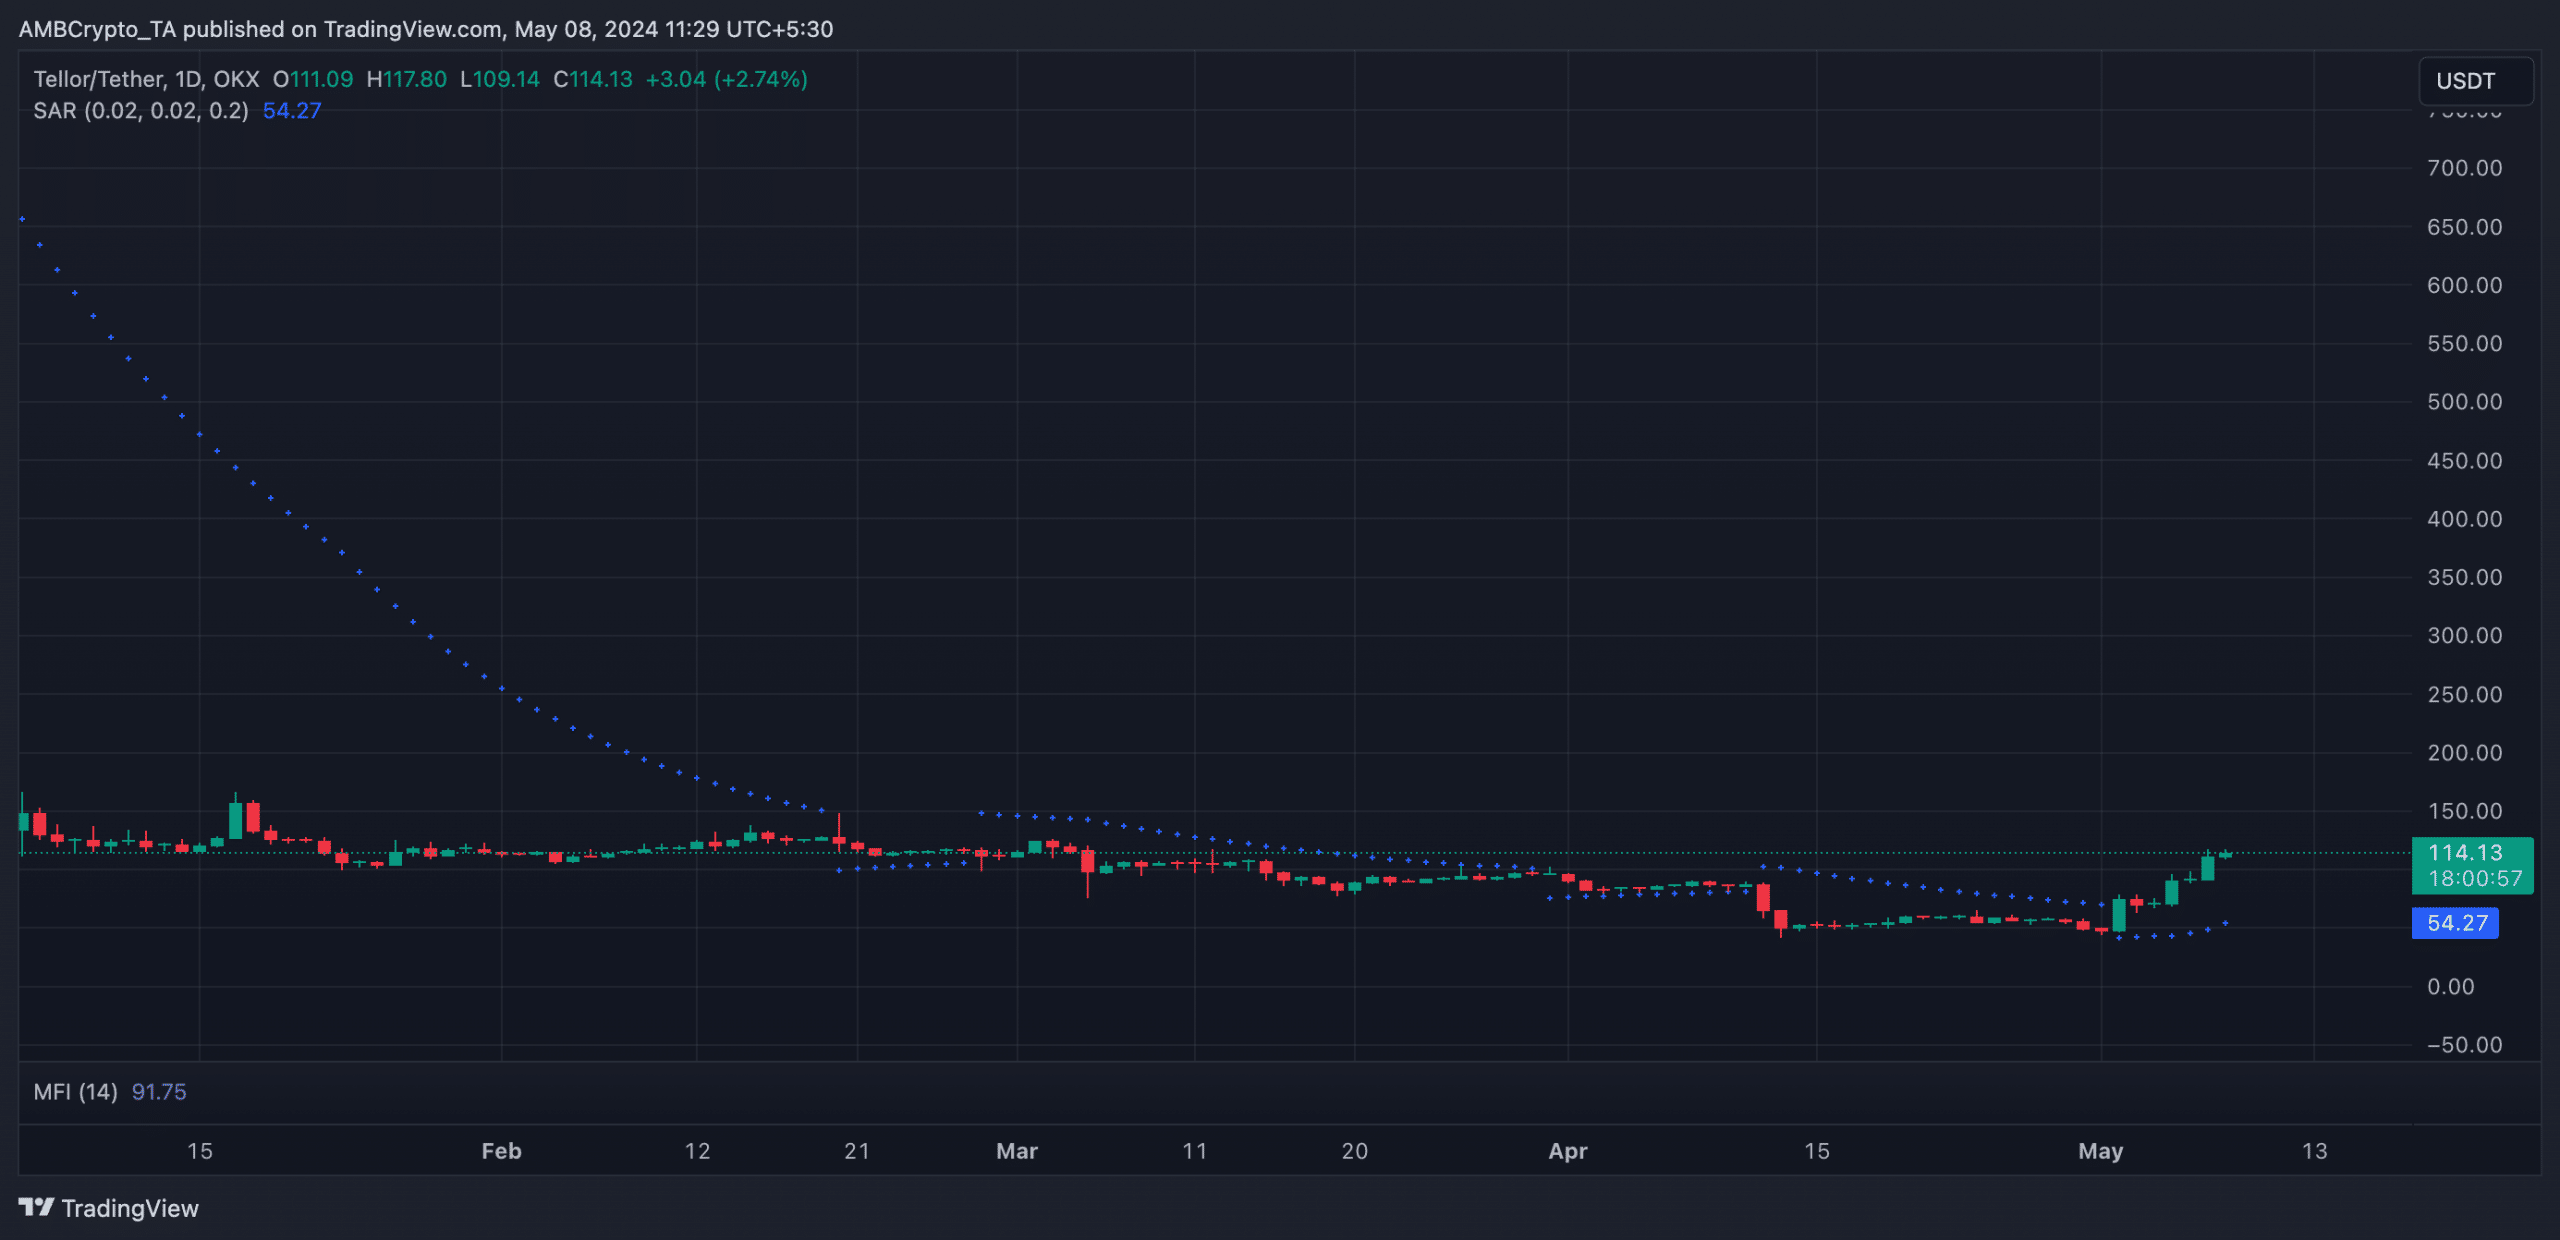
Source: TRB/USDT on TradingView
Realistic or not, here’s TRB’s market cap in BTC’s terms
Regarding how profitable TRB investments have been, AMBCrypto found that in the last month, for every TRB transaction that ended in a loss, 1.04 transactions returned a profit.
This suggested that market participants have made more profit than losses trading the altcoin in the last 30 days.