Tellor prices slide to $120 after hitting $600 – Future predictions?
Since liquidity attracts prices, we could see a bounce in Tellor prices toward $200.

- Tellor traders could see a bounce to $150 or $180.
- The market structure was bearish on the H12 chart.
Tellor [TRB] rose to $629 on 31st December and dipped to $121 just eight hours later. According to Coinglass data for that day, the TRB contract saw the highest amount of contracts wiped out. Its momentum has been bearish since then.
AMBCrypto reported that the Tellor team deposited TRB shortly before the prices soared. This meant that the team was likely involved in dumping the tokens. How do traders navigate these perilous waters?
Both long and short positions could assume large amounts of risk entering into positions here
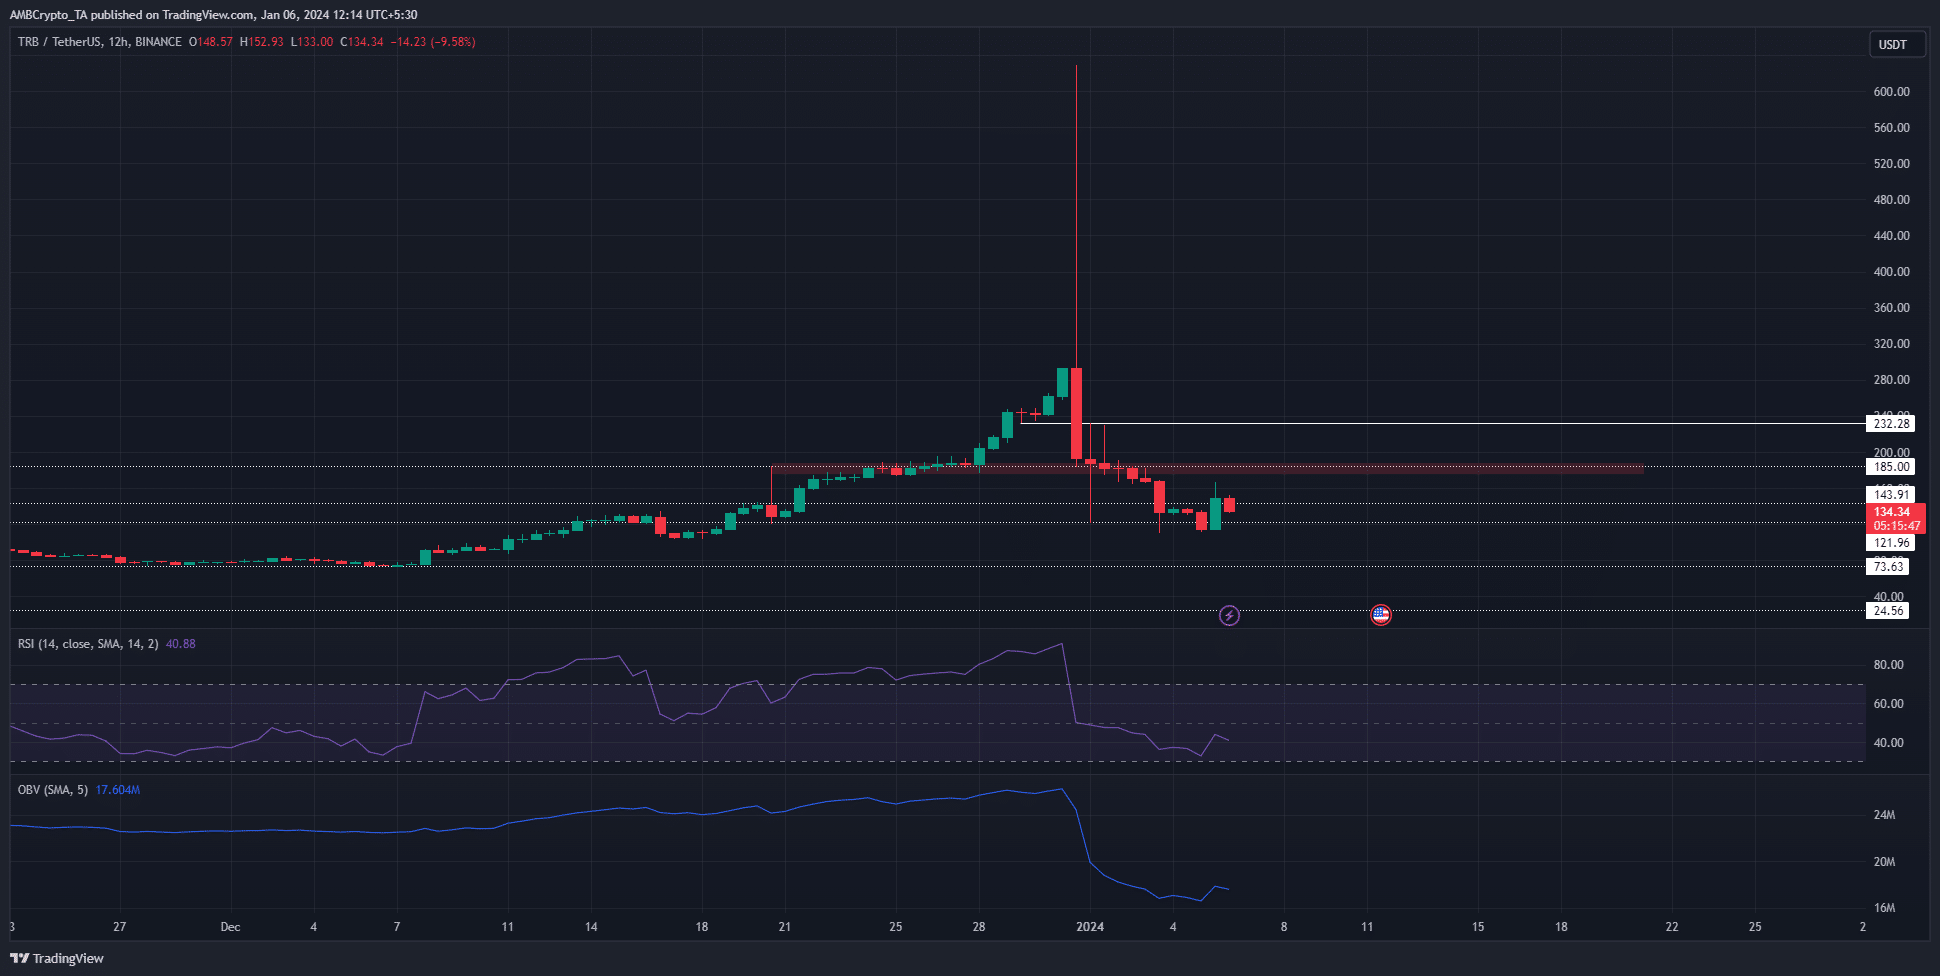
At the time of writing, TRB was trading at $134. To the north, the $143.9 and $185 were high timeframe levels of resistance. In particular, the $185 zone presented a large obstacle to TRB bulls in the latter half of December.
Technical analysis of the lower timeframe price charts showed that the $150-$155 zone rebuffed the bulls on 5th January. Hence, it is possible that short sellers could wait for another bounce to this area before shorting.
Alternatively, they can wait for a move to the $177-$190 region (red box) before selling. This would be a higher probability trade given the importance of the $180 region in the past. Yet, such a bounce might not materialize.
The RSI was below neutral 50 to highlight the firm bearish momentum. The OBV also took a huge dive lower, and buying pressure has been minimal. The Open Interest behind TRB contracts dived on 6 January, reflecting the fearful sentiment.
The liquidation heatmap agreed with the technical analysis

AMBCrypto noted that the Hyblock liquidation heatmap of TRB showed a noticeable pocket of liquidations at $195 and $235. The $150 area did not have a sizeable amount of estimated liquidation levels.
Is your portfolio green? Check the Tellor Profit Calculator
Since liquidity attracts prices, we could see a bounce toward $200. The importance of the $180 area has already been highlighted.
The confluence from the heatmaps meant swing traders could wait for a move to the $180-$200 area. They can gauge the lower timeframes for a spike in selling pressure and enter short positions if warranted.
Disclaimer: The information presented does not constitute financial, investment, trading, or other types of advice and is solely the writer’s opinion.


