Terra, Litecoin, STEPN Price Analysis: 18 April

While the broader market took a nearly 4% 24-hour plunge on its global market cap at press time, Terra, Litecoin and STEPN’s 4-hour RSI swooped toward the bearish side. As this setback occurred on high volumes for these alts, the buyers needed to find their ground soon to stall the current sell-off.
Terra (LUNA)
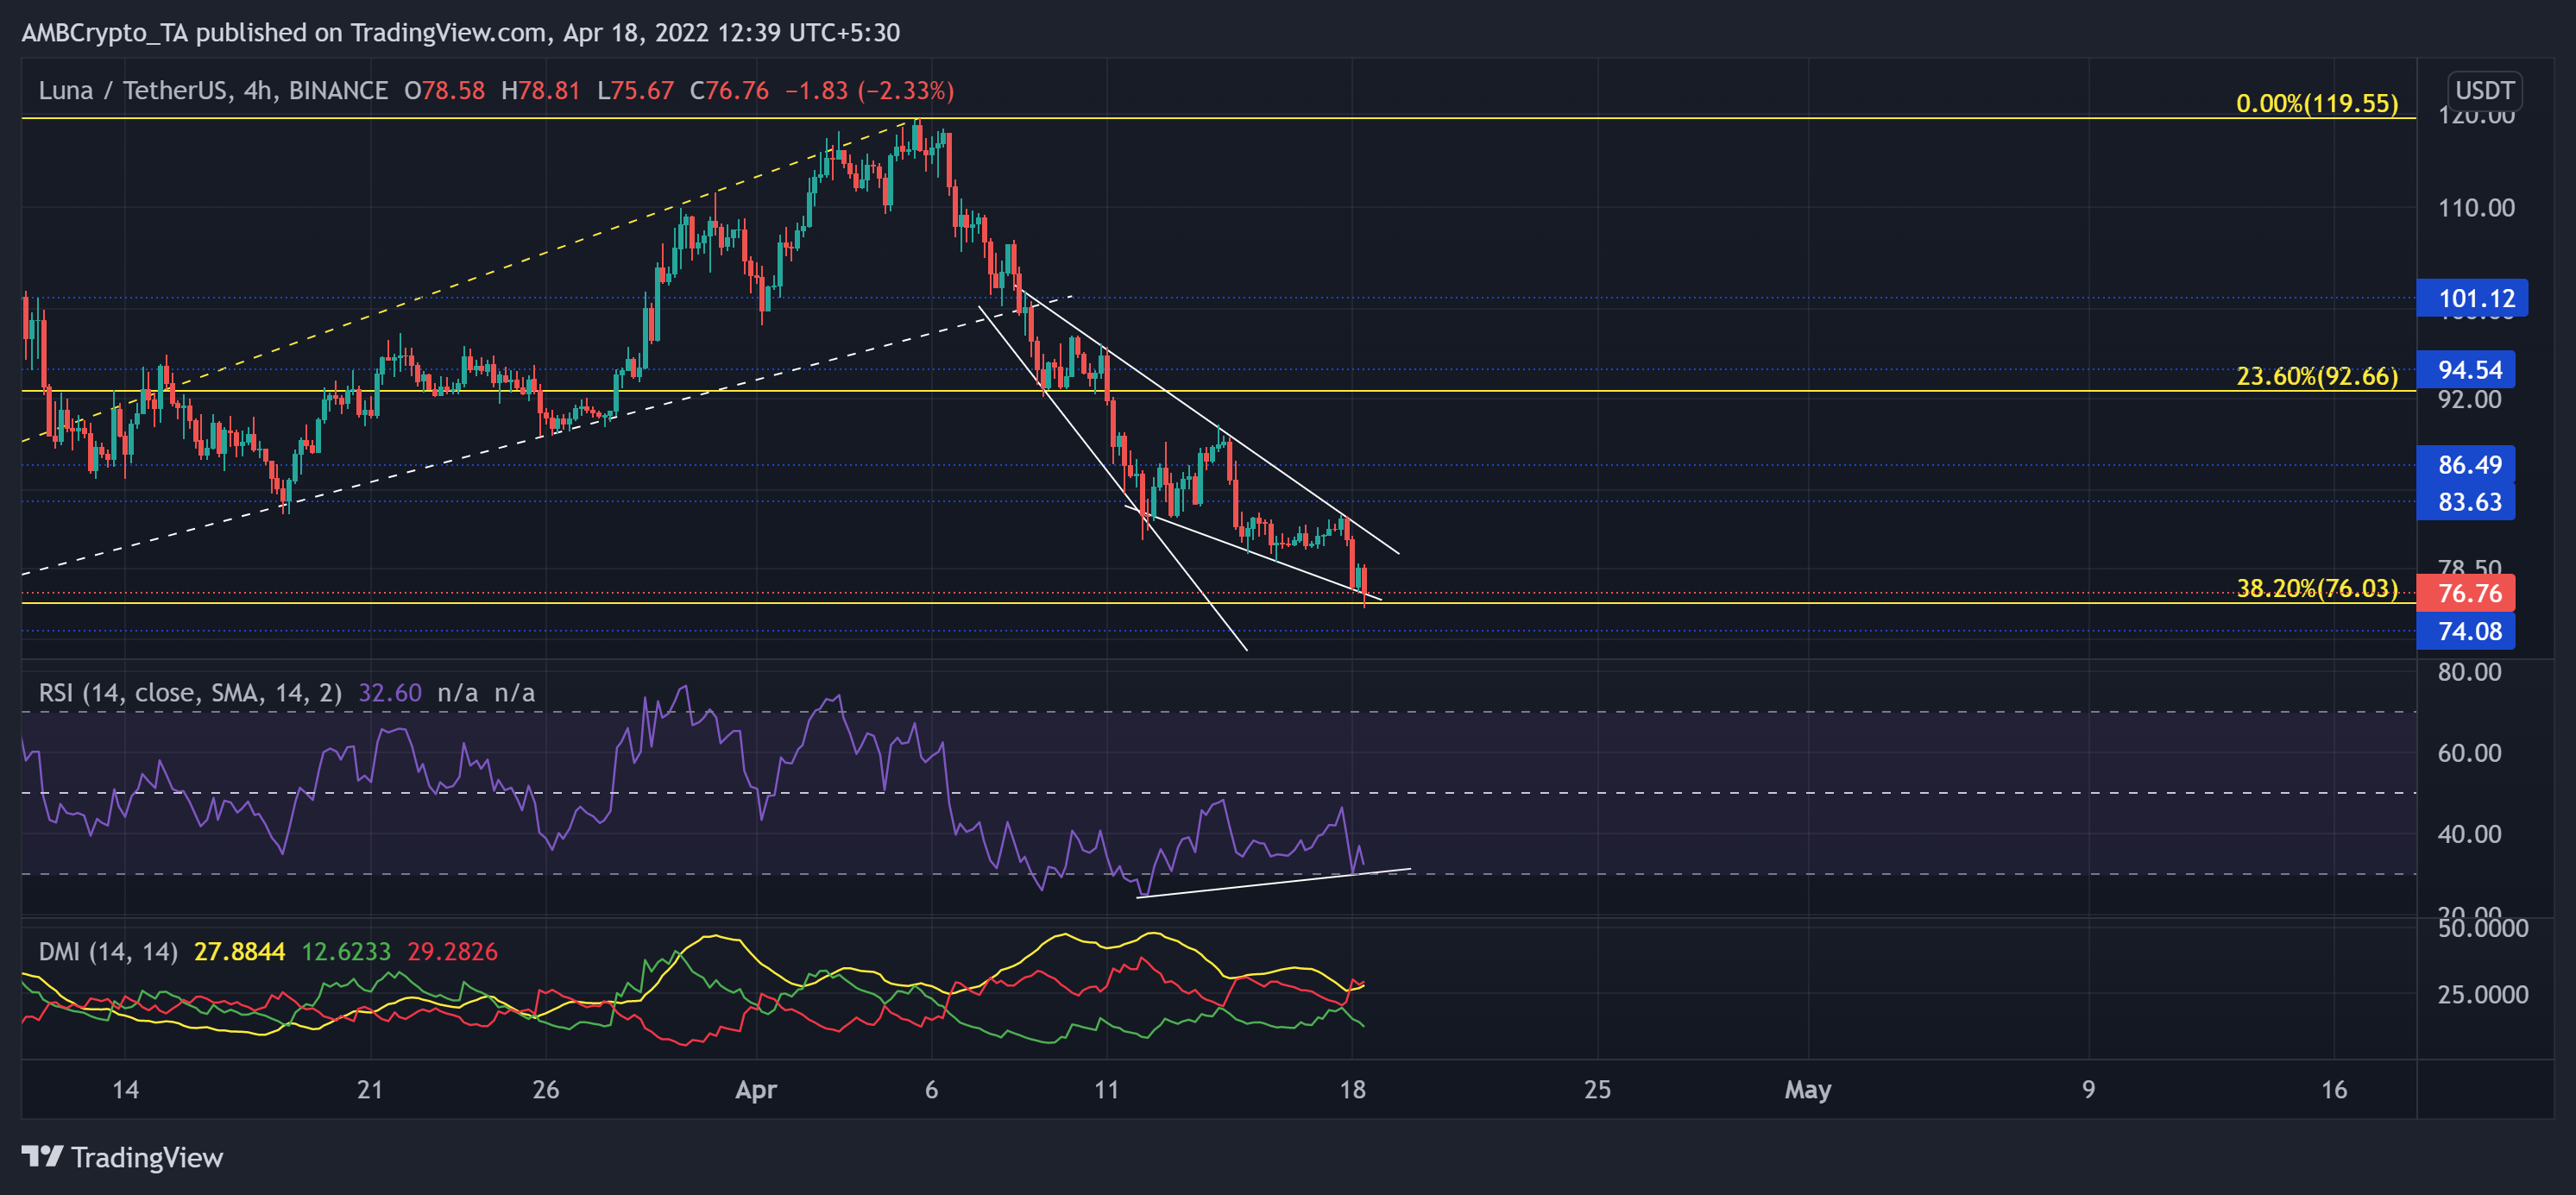
After the sellers tested the long-term 61.8% Fibonacci support for the better part of February, the bulls finally propelled a recovery phase. Consequently, LUNA saw an over 150% growth in the course of the next few days before facing a barrier at the $119-mark.
Over the last 13 days, the alt punctured through some vital price points whilst the bulls uphold the 38.2% support level.
At press time, LUNA was trading at $76.76 after a 5.89% 24-hour loss. The RSI hovered near the oversold mark as the sellers took charge of the near-term trend. Further, due to a bullish divergence with price, a revival could be lurking around the corner. Nevertheless, as the -DI still looked north, it would justify the bearish movements in the short term.
Litecoin (LTC)

In its previous rally, the $101-support reinforced a strong bounce-back. Post this, LTC observed an ascending channel (white) on its 4-hour chart. This rally sprang after the alt matched its 14-month lows on 24 February.
Meanwhile, the bulls found a barrier at the two-month resistance near the $131-mark. Thus, an expected reversal from this mark caused a patterned breakdown that pushed the alt below its 20/50/200 EMA. With the recent bearish crossover of the 20 EMA (red) and 50 EMA (cyan), LTC likely positioned itself for a continued plummet in the near term.
At press time, LTC traded at $106. The southbound RSI lost its mid-line support and exhibited a visible bearish edge. A close below the 37-mark would set LTC for an oversold-mark retest.
STEPN (GMT)

Soon after its listing on Binance, the move-to-earn app saw soaring gains on its charts and entered into price discovery. Settling for a ceiling at the $2.9-mark, GMT registered a gradual plunge on its peaks, as evidenced by the trendline resistance (white, dashed).
The alt ensured an oscillation range of $2-$2.6 since the beginning of this month. The latest bullish cycle ended after a rising wedge (white) breakout that propelled multiple bearish engulfing candlesticks on the 4-hour timeframe.
At press time, GMT was trading at $2.265, down by 5.69% over the last day. Its RSI corresponded with the broader bearish viewpoint of the market and plunged below the equilibrium. However, any recovery from its support would ignite a hidden bullish divergence. Also, the CMF refrained from bowing down to the heightened sell-off situation while swaying above the zero-mark and affirming a bullish edge.


