Terra, STEPN, Waves Price Analysis: 09 April

Bitcoin slipped beneath the $44k area and retested it as an area of supply the previous day, and there was selling seen across the crypto market. Terra and STEPN have been on a downtrend on the lower timeframes, while Waves has seen a severe drop that erased a significant chunk of the gains of the past two weeks.
Terra (LUNA)
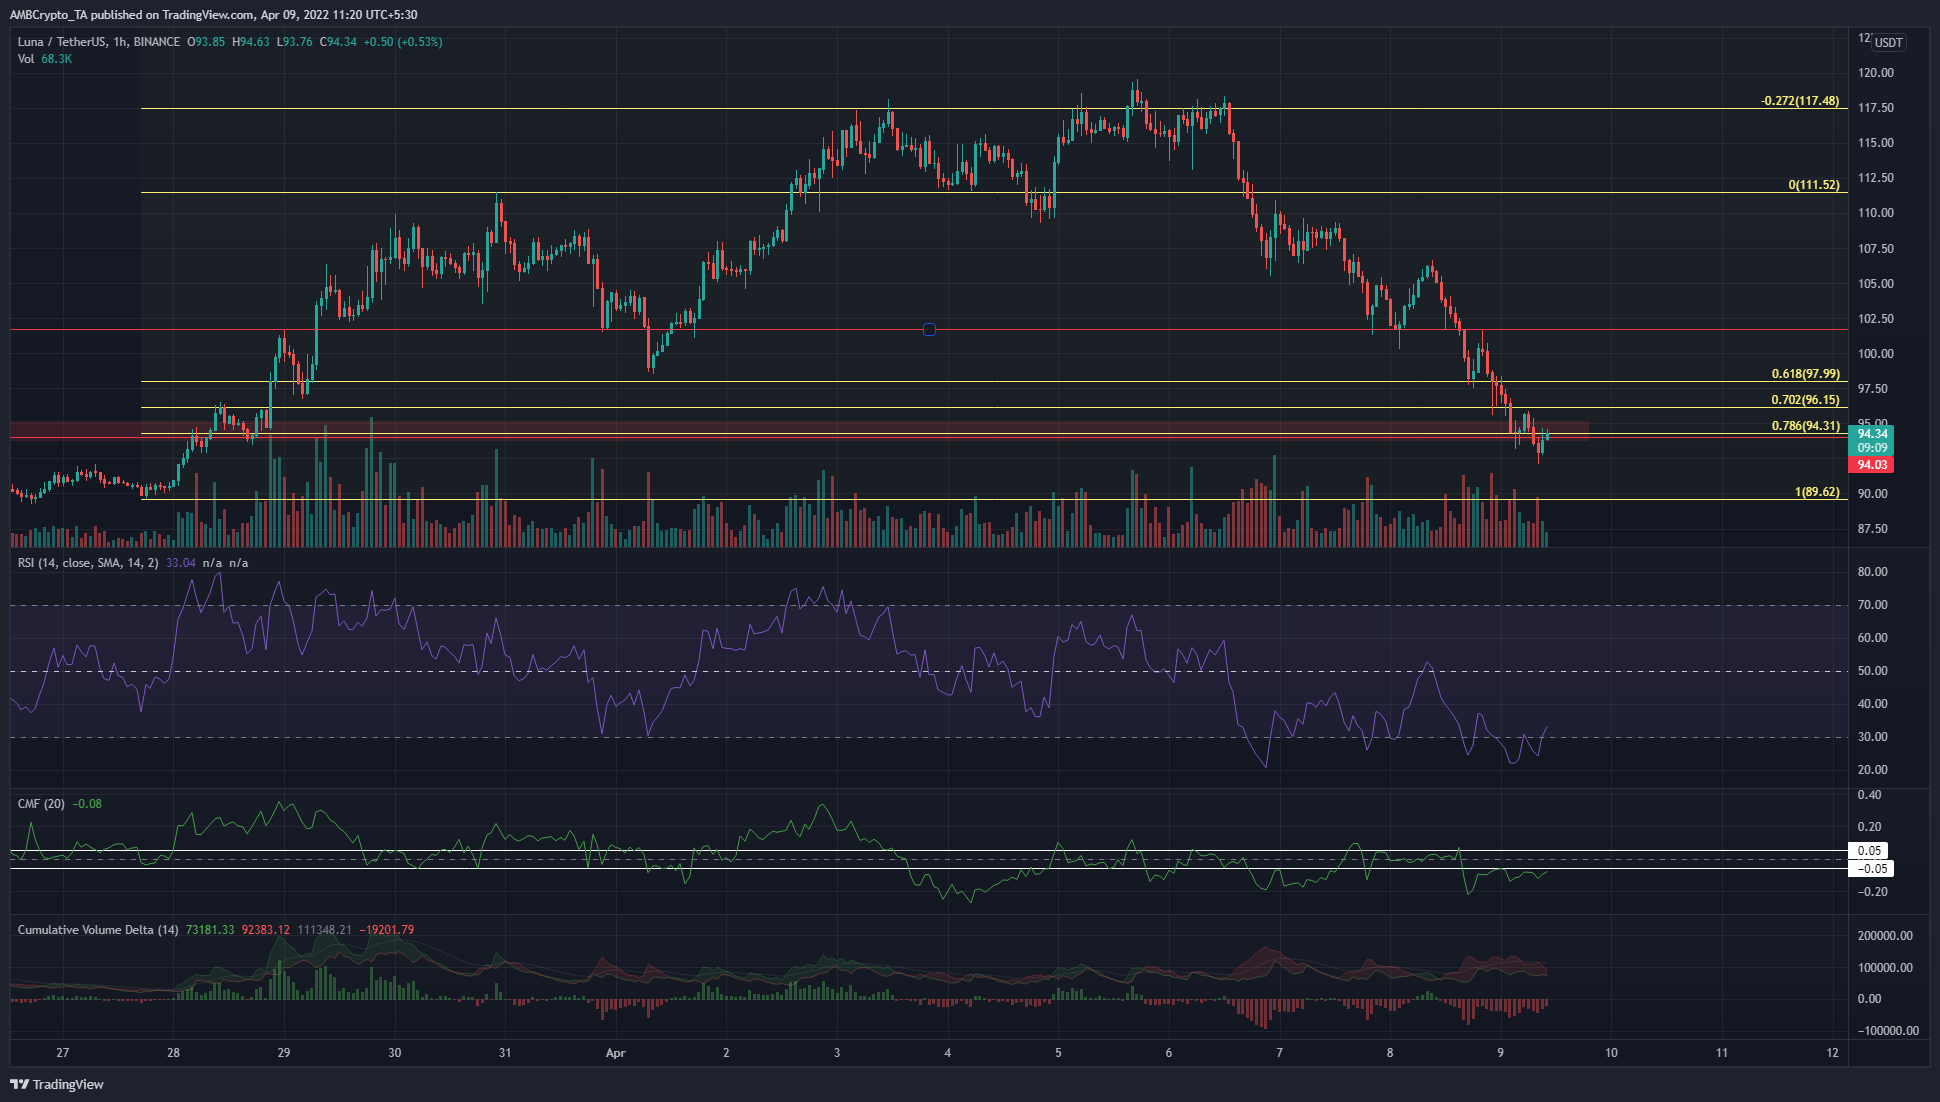
LUNA slipped beneath the resistance zone at $94.3. The Fibonacci retracement levels (yellow), especially the 61.8%-78.6% levels which are levels where the price consolidates before a reversal, failed to see sufficient demand.
The momentum behind LUNA was bearish as the RSI stood at 333, and it was likely that in the next few hours LUNA would post further losses. The RSI has been below neutral 50 for the past couple of days, and the CMF also slipped beneath -0.05 to show strong selling pressure. The Cumulative Volume Delta was also in the red.
STEPN (GMT)
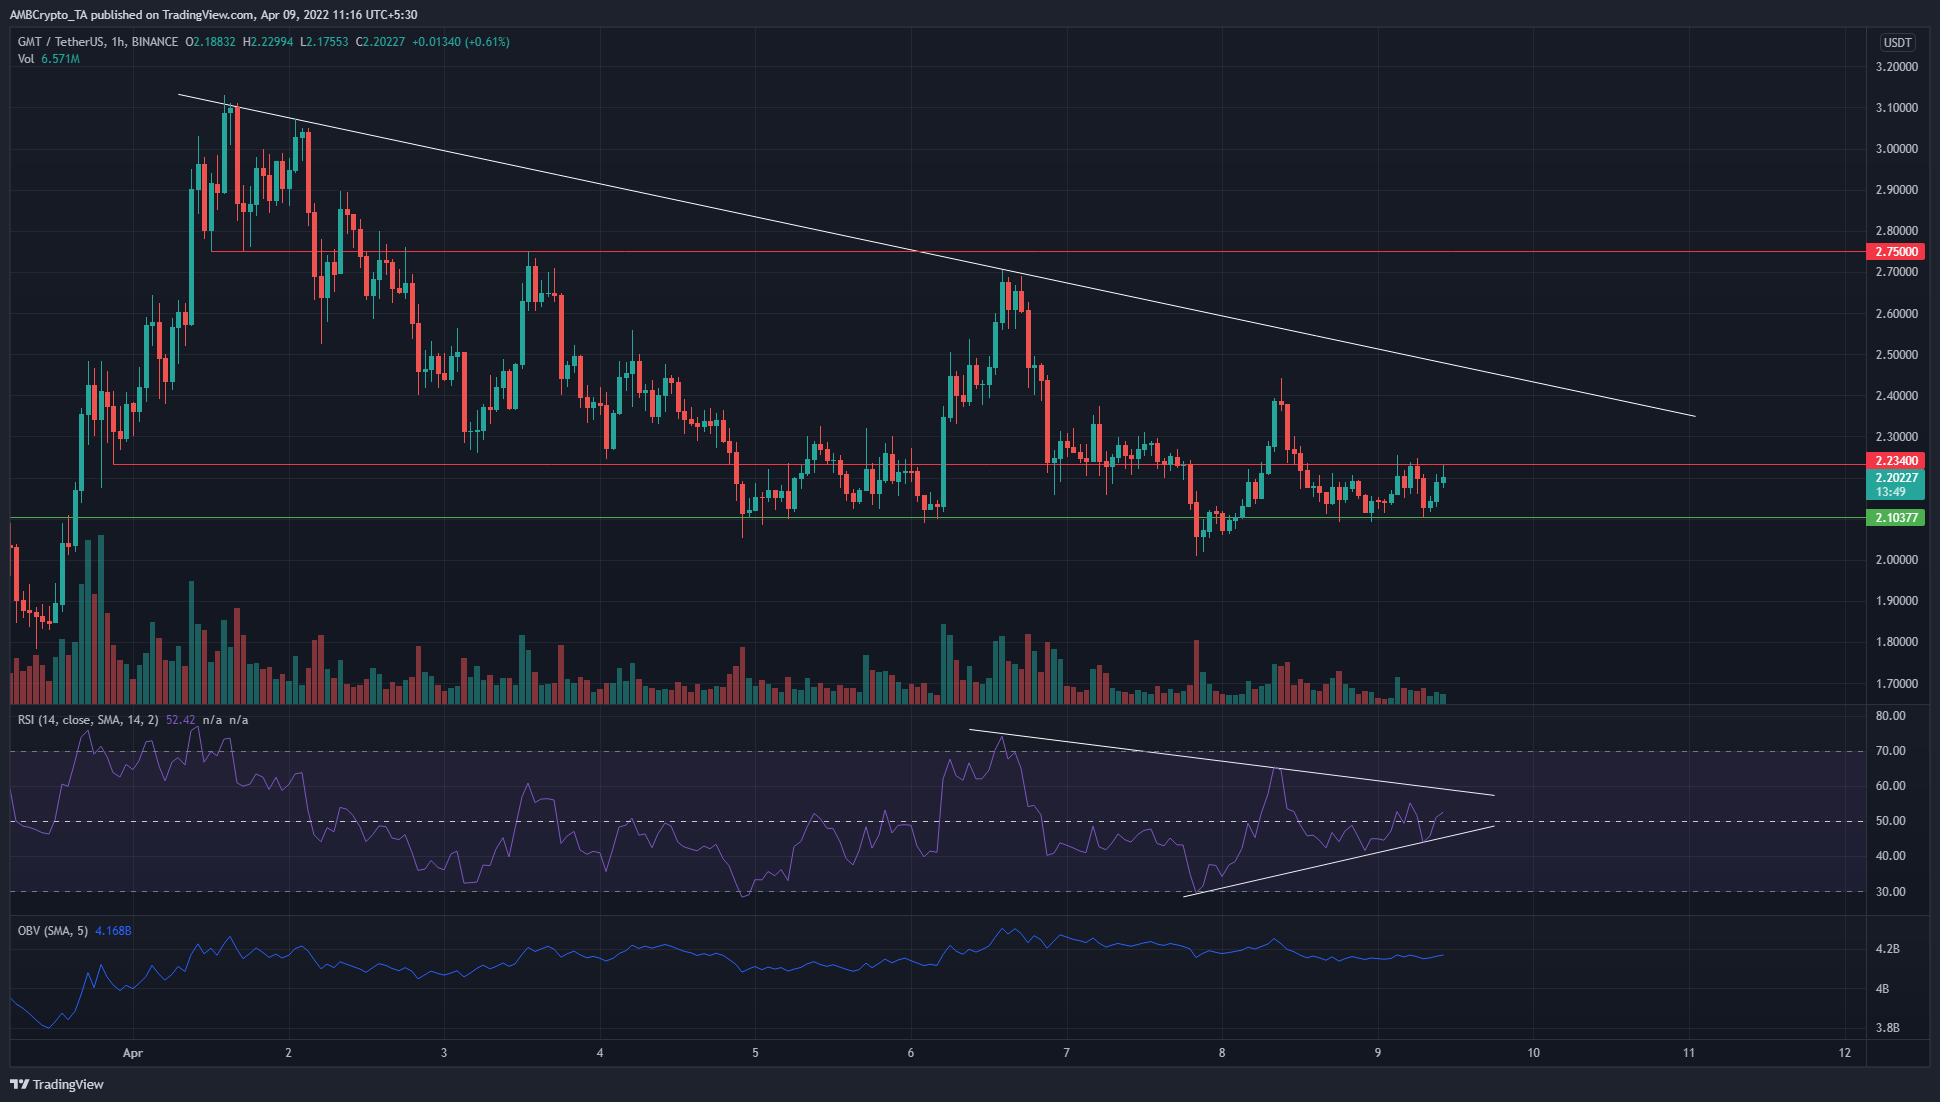
After extraordinary gains, GMT has seen some compression in the past week, as the price repeatedly retested the $2.1 support level and set a series of lower highs. The $2.1 and $2.23 are levels of importance in the near term, and further north the $2.4 area would likely offer resistance.
The descending trendline resistance of the past ten days (white) would also be a level that bulls would like to beat, in order to effect a breakout.
The RSI, alongside the price, showed how momentum has stalled in recent days and was straddling the fence at neutral 50. The OBV has also been relatively flat, but selling volume has been slightly higher than buying in the past couple of days.
Waves (WAVES)

WAVES was another coin that has seen significant selling pressure in the past few days. The Fibonacci levels (yellow) presented the 27.2% extension level at $24.64, with a horizontal support level at $23.39 as well.
The A/R showed the selling pressure was steady and greater than the buying, while the RSI also showed strong bearish momentum. $25.5, $24.4 and $21.6 are targets for short positions from $27 or higher to take profit at.


