Terra, Tezos, Aave Price Analysis: 11 January

As Bitcoin managed to cross its 20-SMA, Terra clawed back and regained its 50% Fibonacci support. However, its OBV struggled to match up to the recent spike.
Tezos continued to flash weak near-term technical indications after oscillating in a down-channel on its 4-hour chart. It may test the $3.8-support again before a possible recovery. On the other hand, Aave formed a bullish pattern while maintaining a healthy buying pressure.
Terra (LUNA)

Over the past week, the alt saw an expected rising wedge (green) break down on its 4-hour chart. Since then, the alt marked a 31.67% decline in a down-channel (white) and poked its three-week low on 08 January.
Since then, the alt saw an impressive 16.7% recovery after rebounding from the 61.8% level.
LUNA regained the 50% support level and crossed the 20-SMA (red). The immediate testing point for the bulls stood at the $74.9-level. Any breakdowns would find testing support at the $69-level.
At press time, LUNA traded at $72.68. The RSI showed improvement signs as it strove to find a sustained close above the half-line. Meanwhile, the Supertrend continued to flash sell signals. Also, the OBV failed to mark a corresponding spike with the recent hike, hinting at weak buying pressure.
Tezos (XTZ)
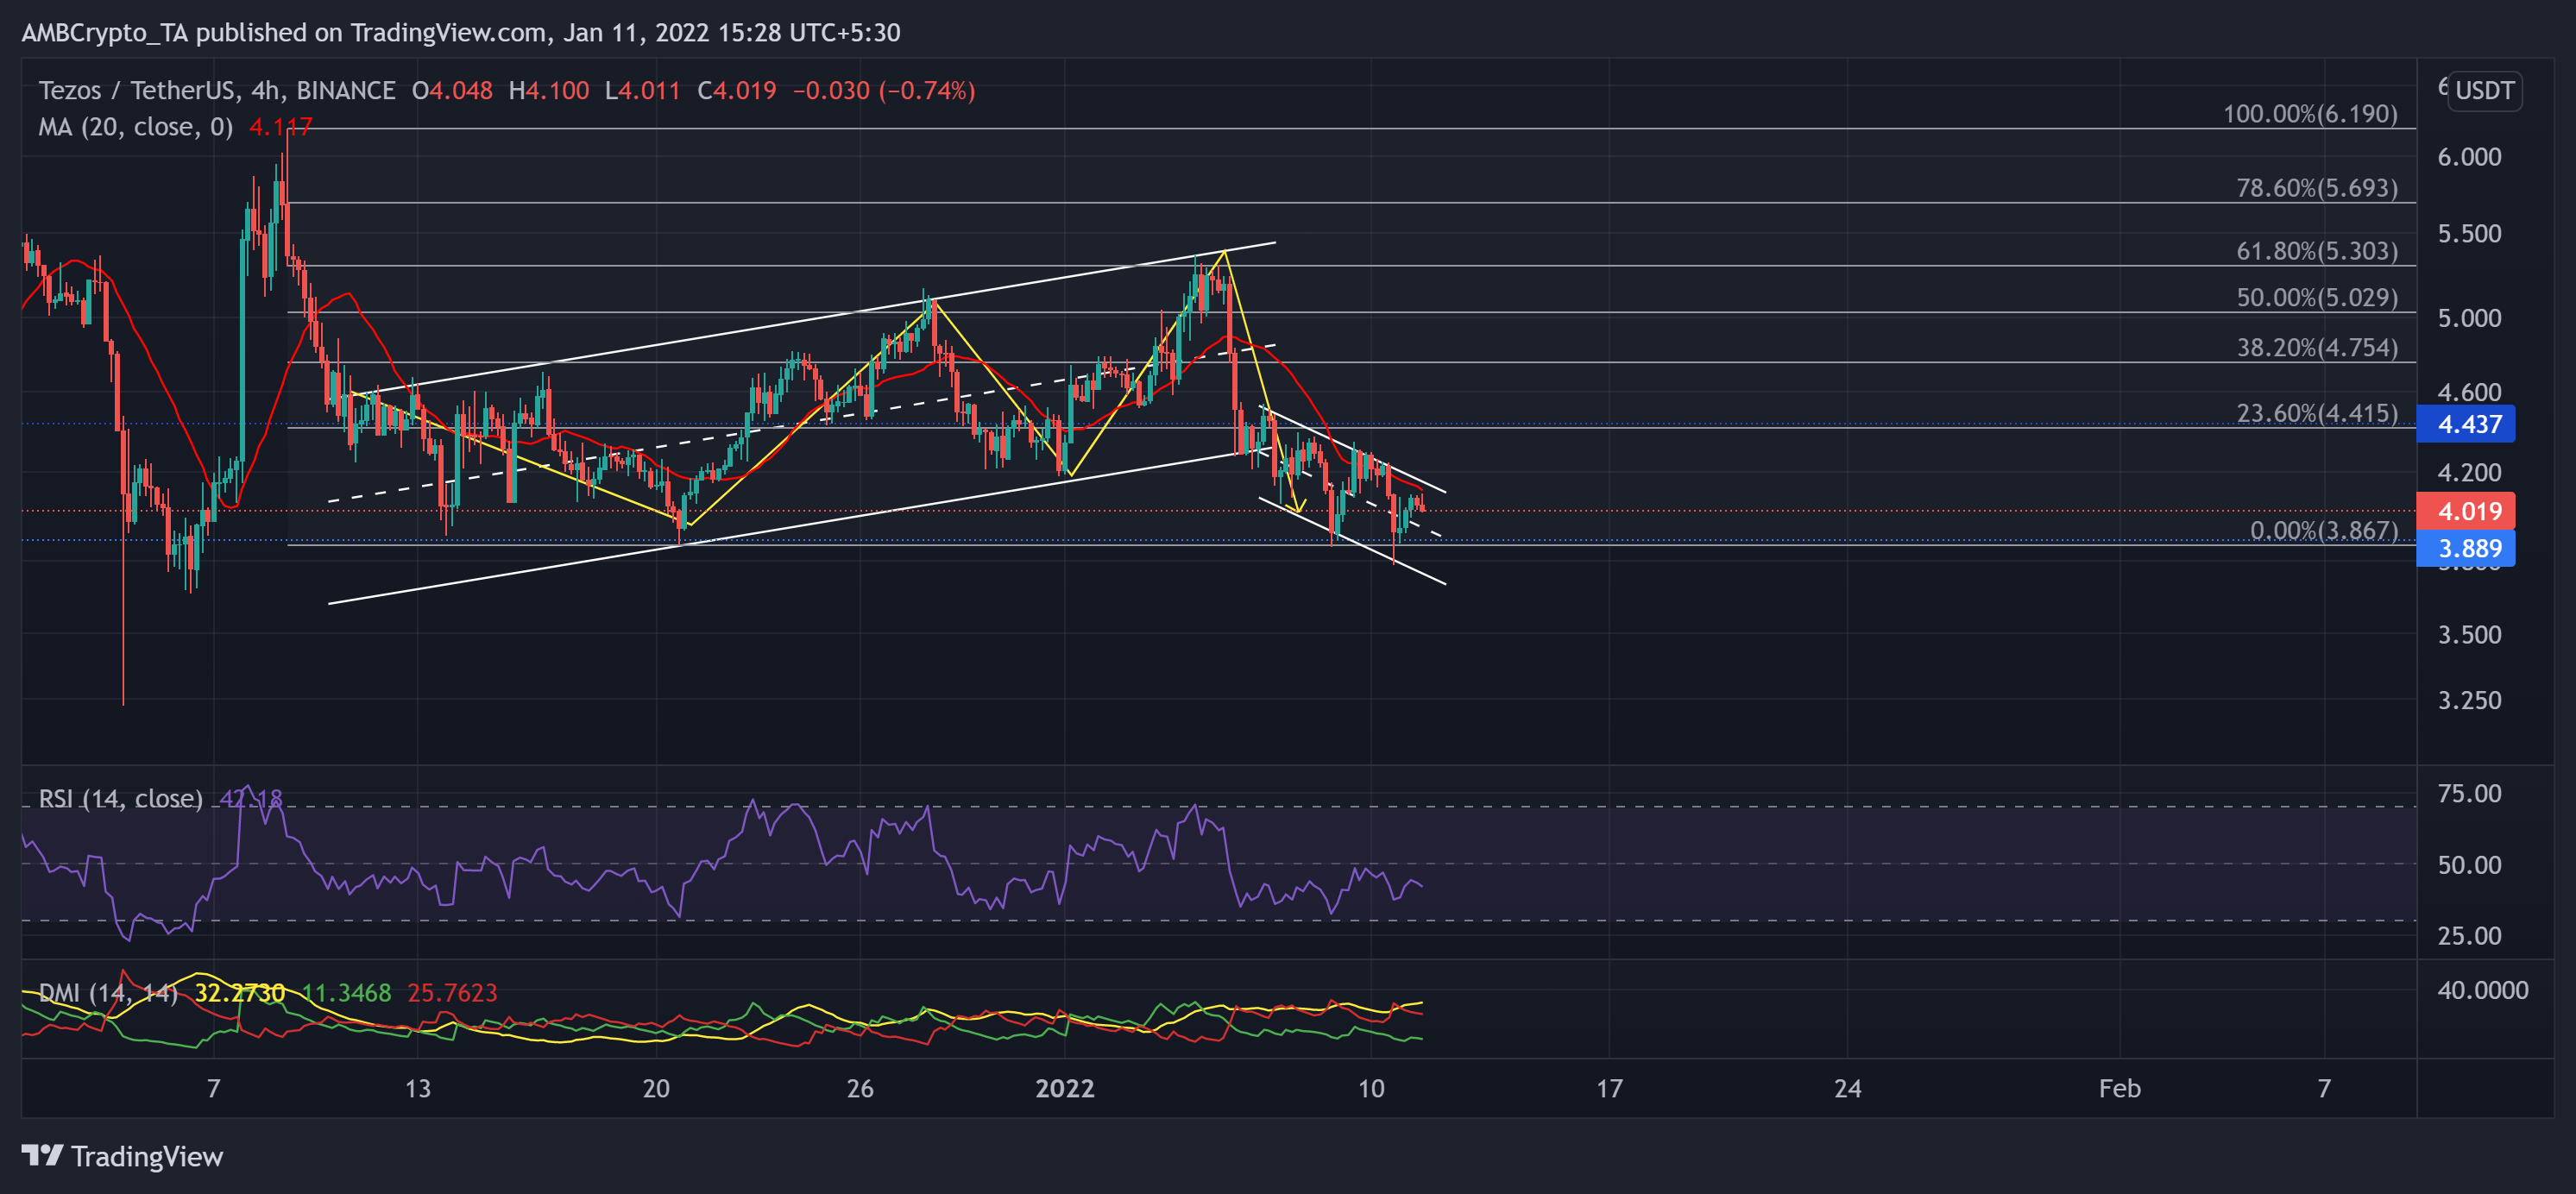
As XTZ bulls ensured the four-month support at the $3.8-mark, the price action witnessed a decent recovery. As it marked an up-channel (white), the alt breached multiple resistance until it poked its monthly high on 04 January.
Then from the 61.8% Fibonacci resistance, it retraced by 29.4% and bounced back from the $3.8-level. Now, as XTZ pulled back from its 20-SMA (red), it seemed to approach its immediate support at the aforementioned level.
At press time, XTZ traded at $4.019. The RSI continued to sway below the half-line and chose the bears. Further, the widened gap between the DMI lines reaffirmed ht previous analysis by flashing a bearish bias.
AAVE
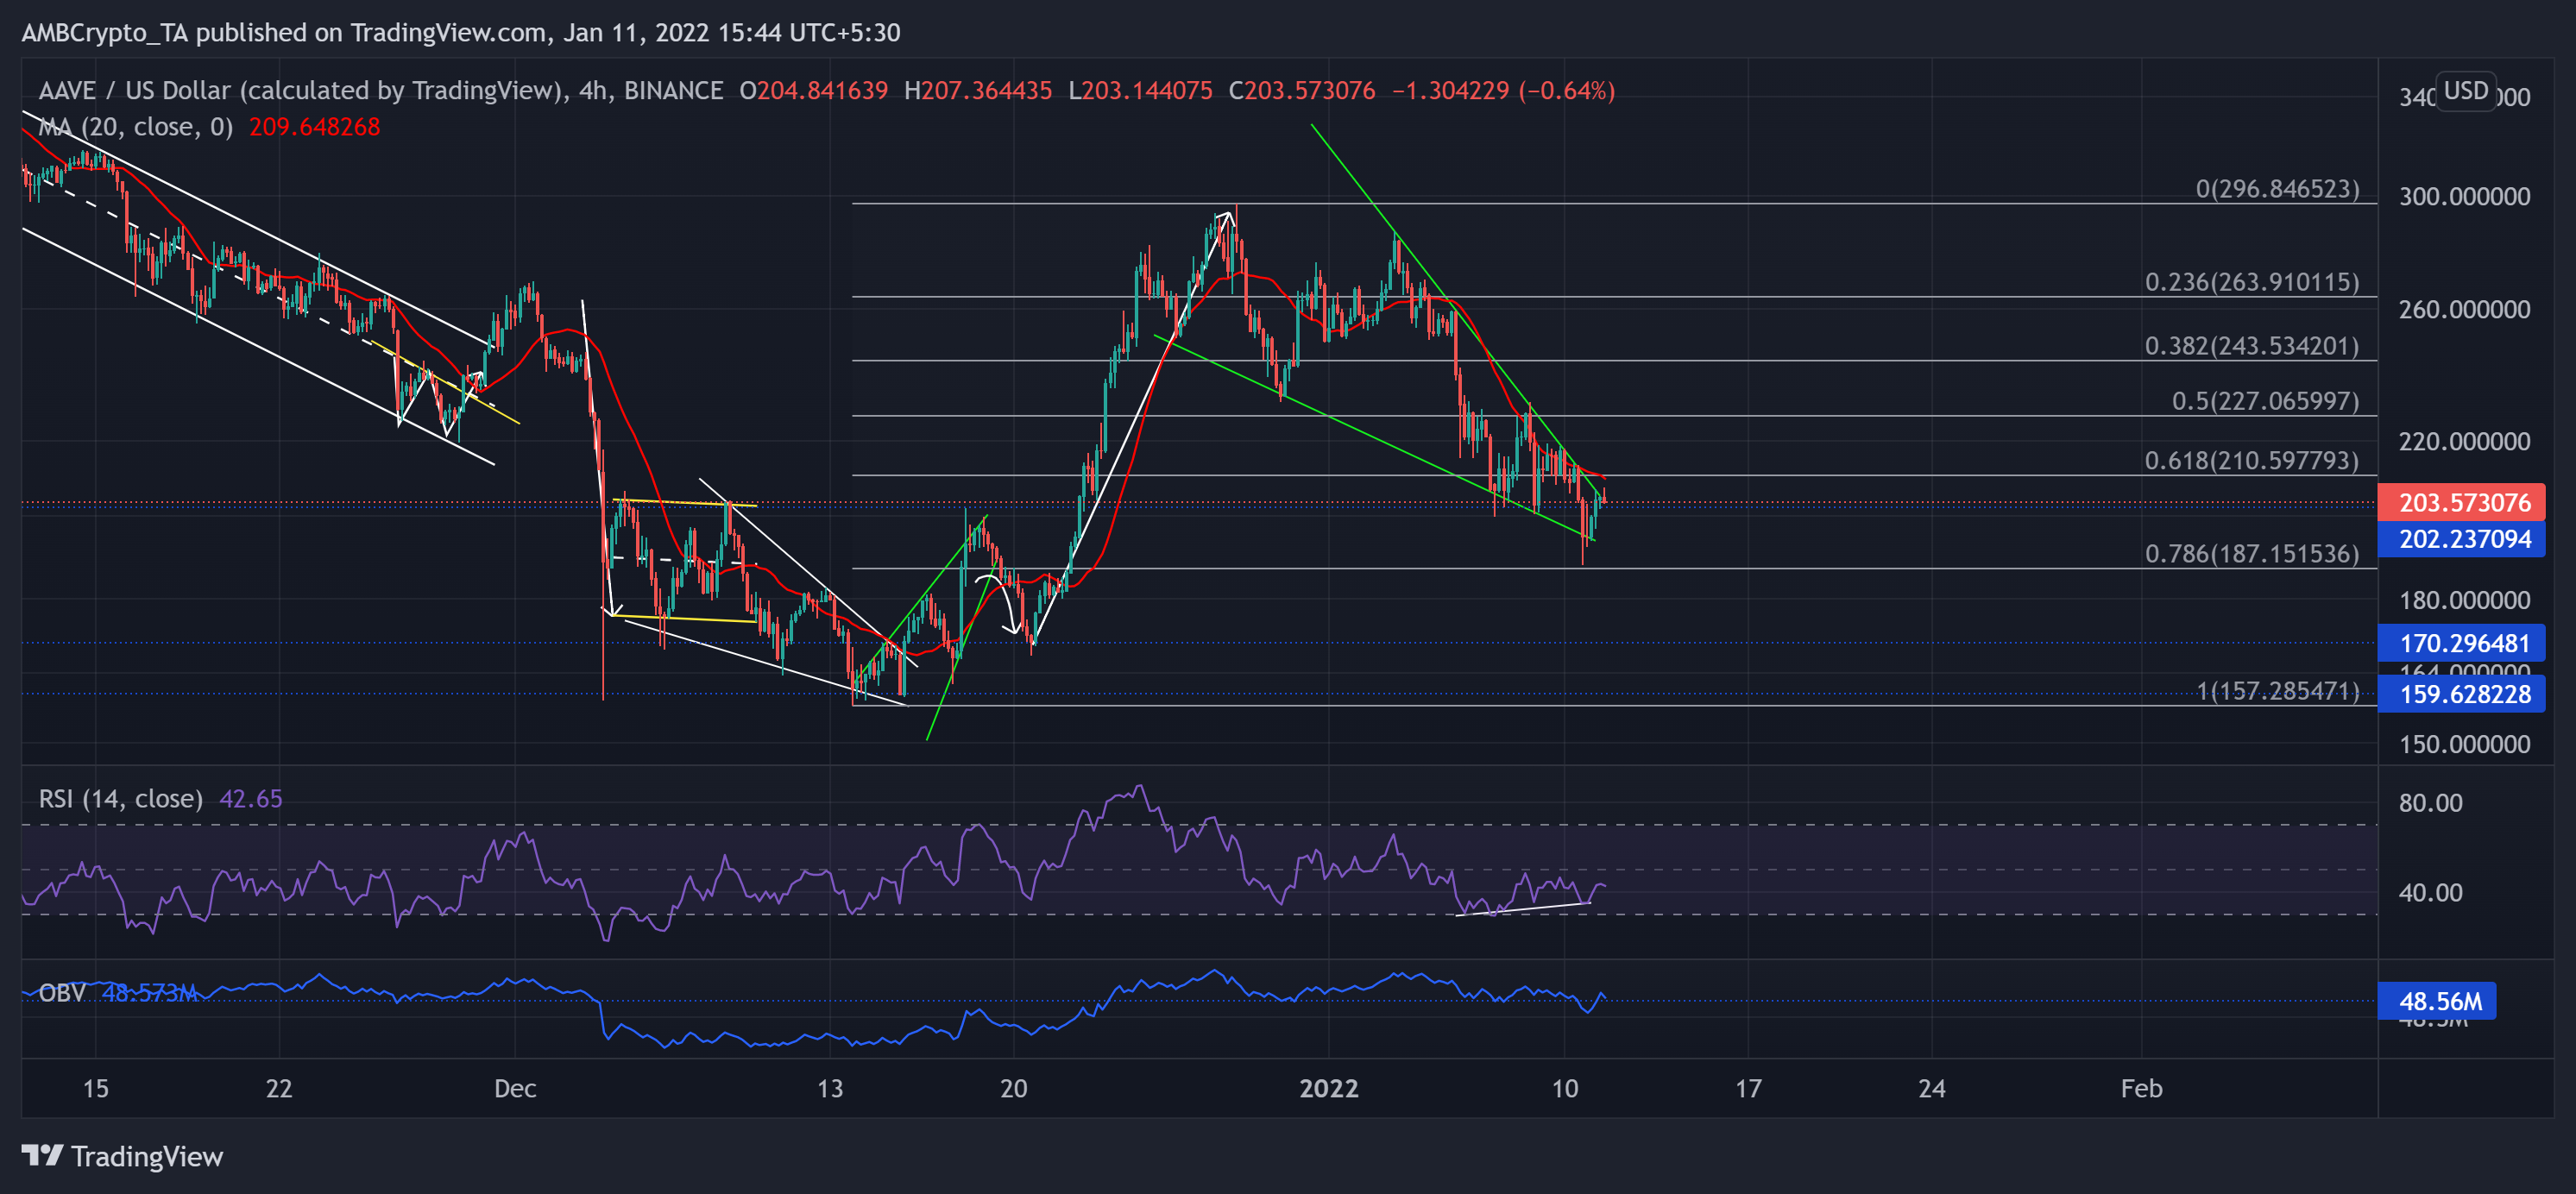
The alt reversed its descent from the critical $159-mark long-term support on 15 December. It saw a staggering 84.8%ROI (from 15 December low) until it poked its six-week high on 28 December and found resistance near the 61.8% Fibonacci level.
Over the past few days, AAVE saw a falling wedge (green, reversal pattern) and lost the vital 61.8% Fibonacci level. Now, the bulls seemingly found support at the $202-mark, followed by the 78.6% level.
A compelling close above the 20-SMA (red) near the $210-mark would confirm a strong potential breakout.
At press time, AAVE traded at $203.57. The RSI wavered below the half-line and flashed an uptrend. Despite a substantial plunge, the OBV maintained its near-term support level. This reading indicated a superior buying strength.