Tezos, Dash, Waves Price Analysis: 15 March

Tezos moved within a descending channel but the bulls could fight back at $3.78 support. Dash presented an upside of $278 in a bullish outcome, while WAVES threatened to move below its 23.6% Fibonacci level.
Tezos [XTZ]
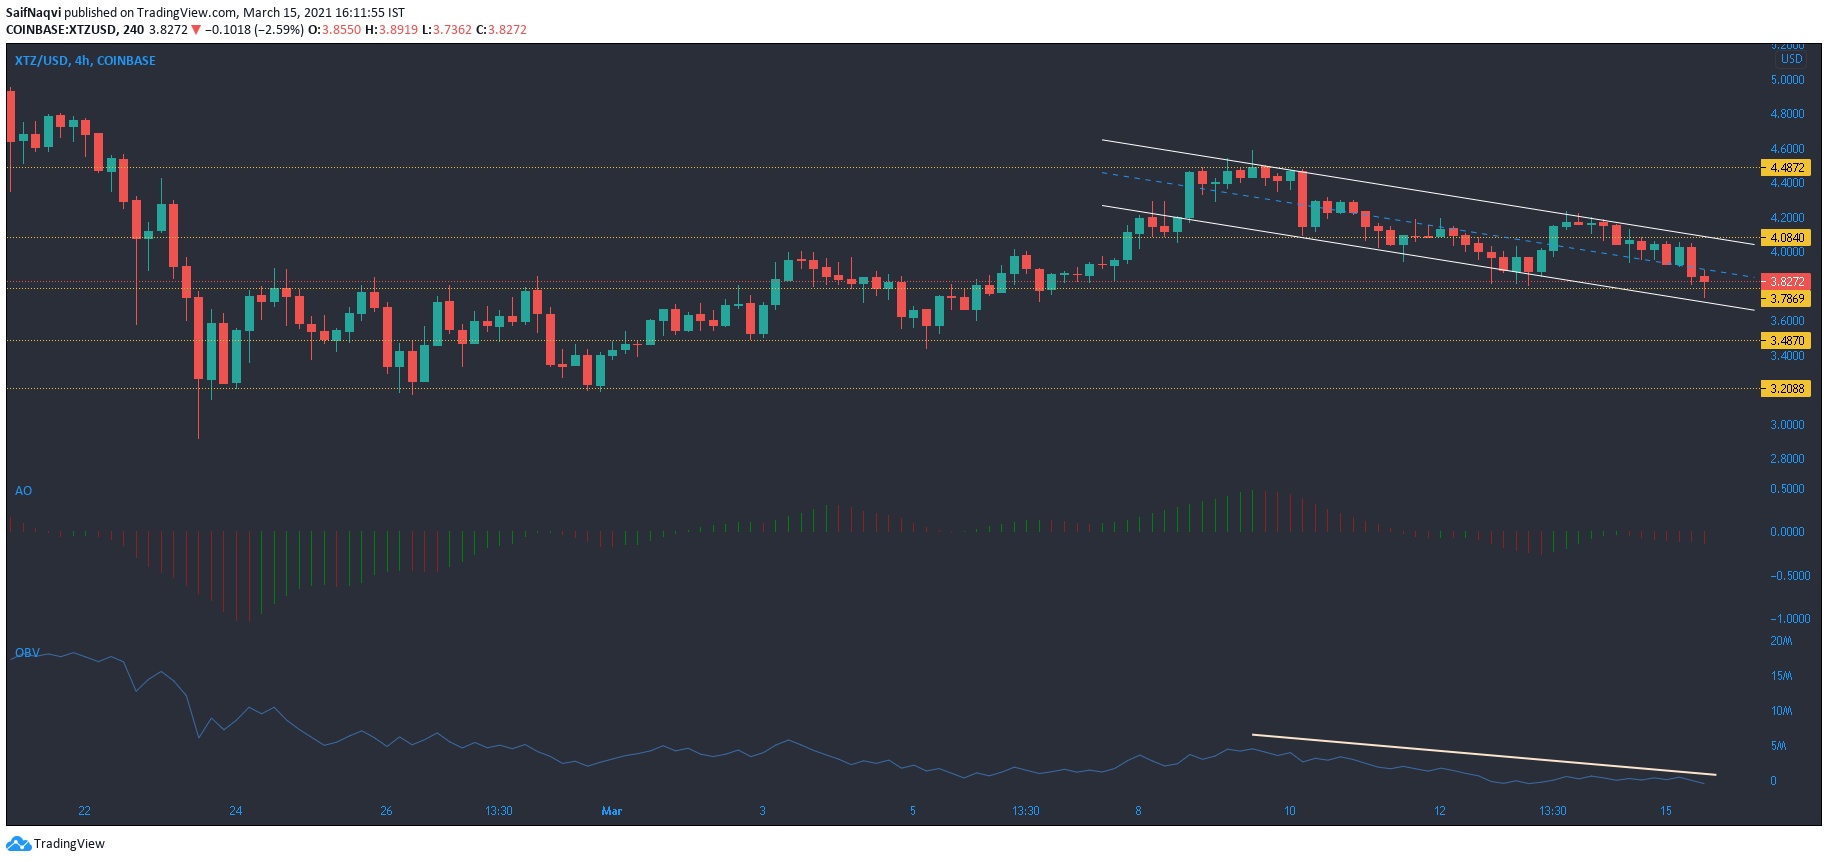
The recovery on Tezos was halted at $4.48 resistance and a descending channel emerged as the price formed lower highs and lower lows on the 4-hour timeframe. The OBV moved in tandem with the price as sellers dragged XTZ lower at various levels. The Awesome Oscillator showed momentum behind the selling side. Support at $3.78 would be under the spotlight in the short-term and buyers would be expected to offer some resistance at that mark.
A fall all the way towards $3.12 support could offer up some buying opportunities for long-term traders, but the bears would need to initiate a move below the $3.48 level first.
Dash [DASH]
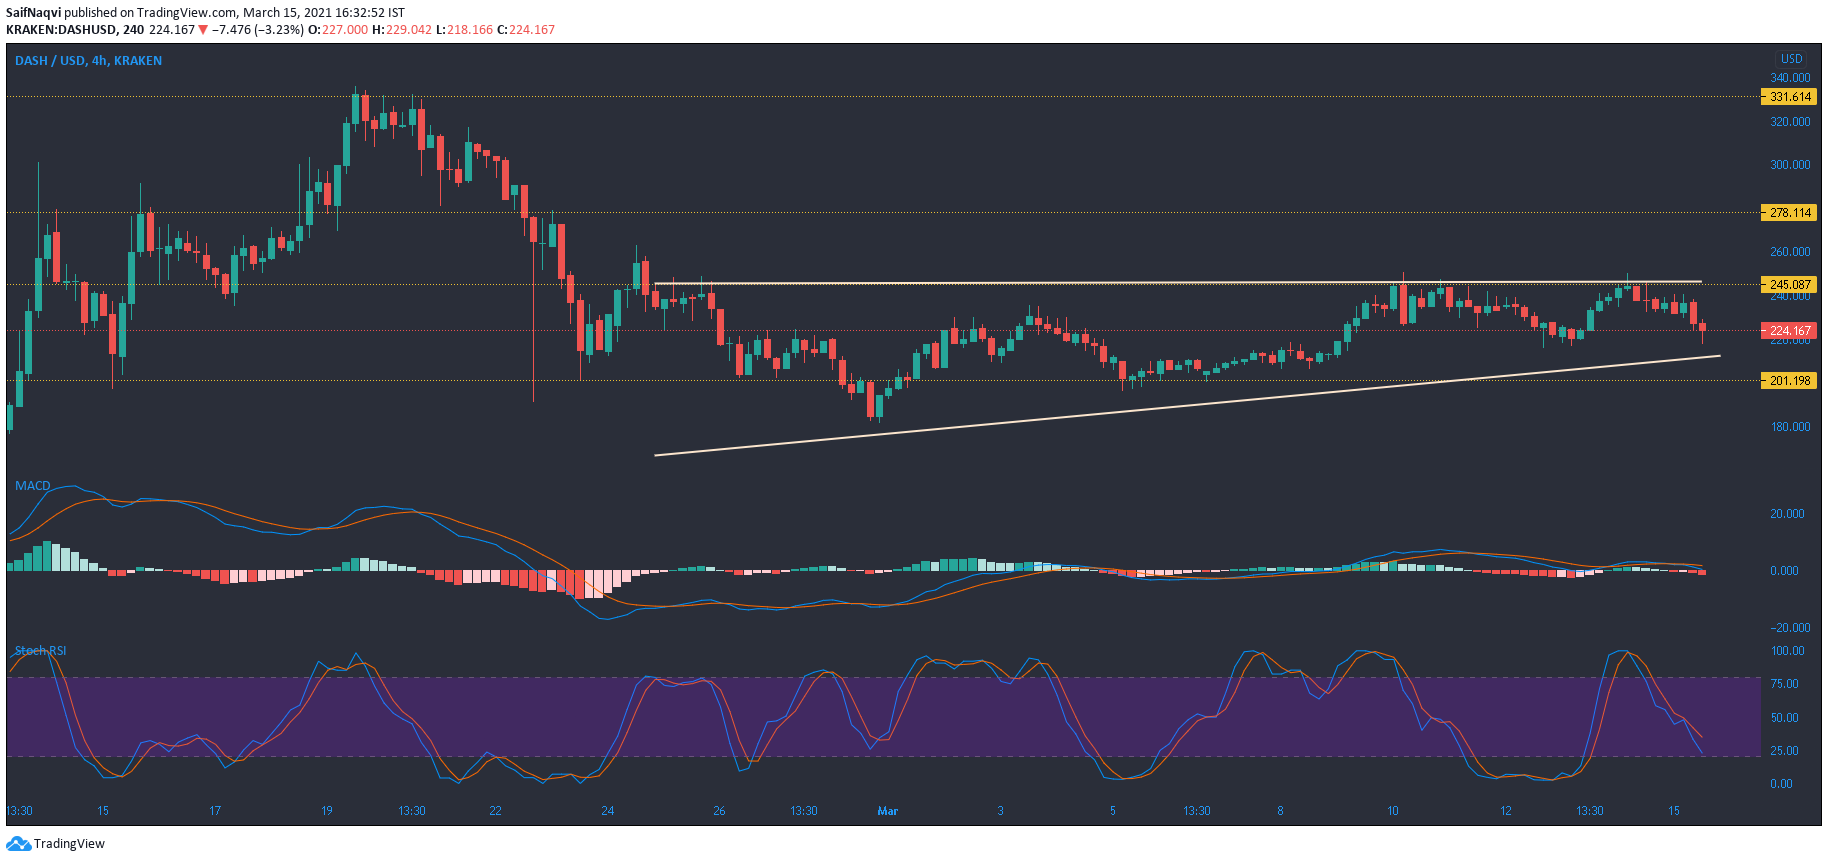
The formation of higher lows was an encouraging sign for the future trajectory of Dash, but gains were largely capped at $245.1 resistance. This led to the formation of an ascending triangle on the 4-hour chart. While this pattern generally sees an upwards breakout, bullish cues from the broader market could be needed to enforce a move above the upper trendline. The indicators did not favor a breakout and instead pointed towards short-term bearish conditions.
The Stochastic RSI closed in on the oversold region, while the Signal line gained some distance on the MACD line. Upside resides at $278.1 if DASH is able to flip its bear market and break north from the upper trendline.
Waves [WAVES]
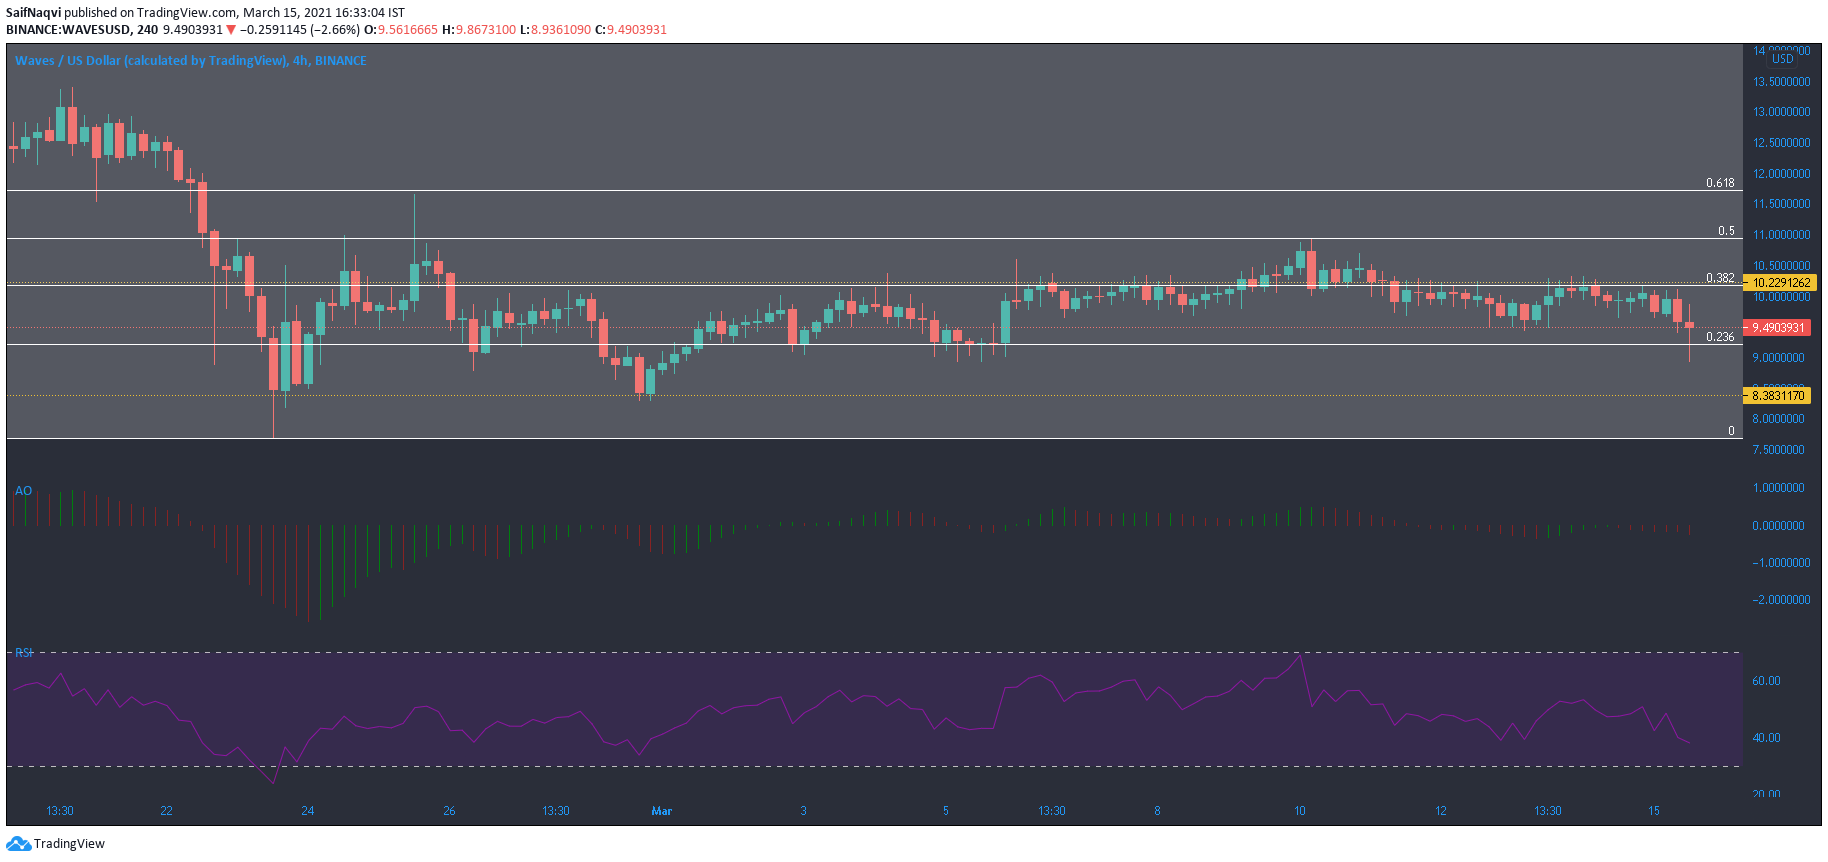
The 38.2% Fibonacci level, which rested at $10.2, has been a difficult level to sustain for the Waves’ bulls. The aforementioned mark has been met with selling pressure on two occasions since the broader market pullback in late-February. At the time of writing, the price threatened to move lower from the $23.6% Fibonacci level as well, an area that was maintained by the bulls for over two weeks.
The RSI pointed lower from the 40-mark, while the momentum grew on the selling side according to the Awesome Oscillator. The next line of defense resided at $8.38.