Tezos, Ethereum Classic, EOS Price Analysis: 28 February

After the market retraced in the last 24 hours, Tezos fell below its 20-50-200 SMA while Ethereum classic fell below its EMA ribbons. Further, EOS struggled to topple its 20 EMA but kept the bullish revival hopes alive after displaying a strong CMF.
Tezos (XTZ)

The previous bull rally from its six-month low saw exceptional gains that found a ceiling at the $4.5-mark. Then, XTZ saw an over 40% pullback as it fell in a descending broadening wedge (white) and matched its January lows.
From its $2.6, 26-week support, the bulls propelled a 34.7% rally above the 20-50 SMA that was shunned by the $3.4-resistance. However, since the last day, XTZ saw a strong pullback towards the $3-mark. But if the 20 SMA (red) sustains above the 50 SMA (grey), it would reveal a bullish edge in the coming days.
At press time, the alt traded below its 20-50-200 SMA at $3.089. Over the last day, the RSI fell below the midline and affirmed a bearish edge. Also, the Volume Oscillator was declined below its equilibrium during the breakout phase, hinting at a weak bull move.
Ethereum Classic (ETC)
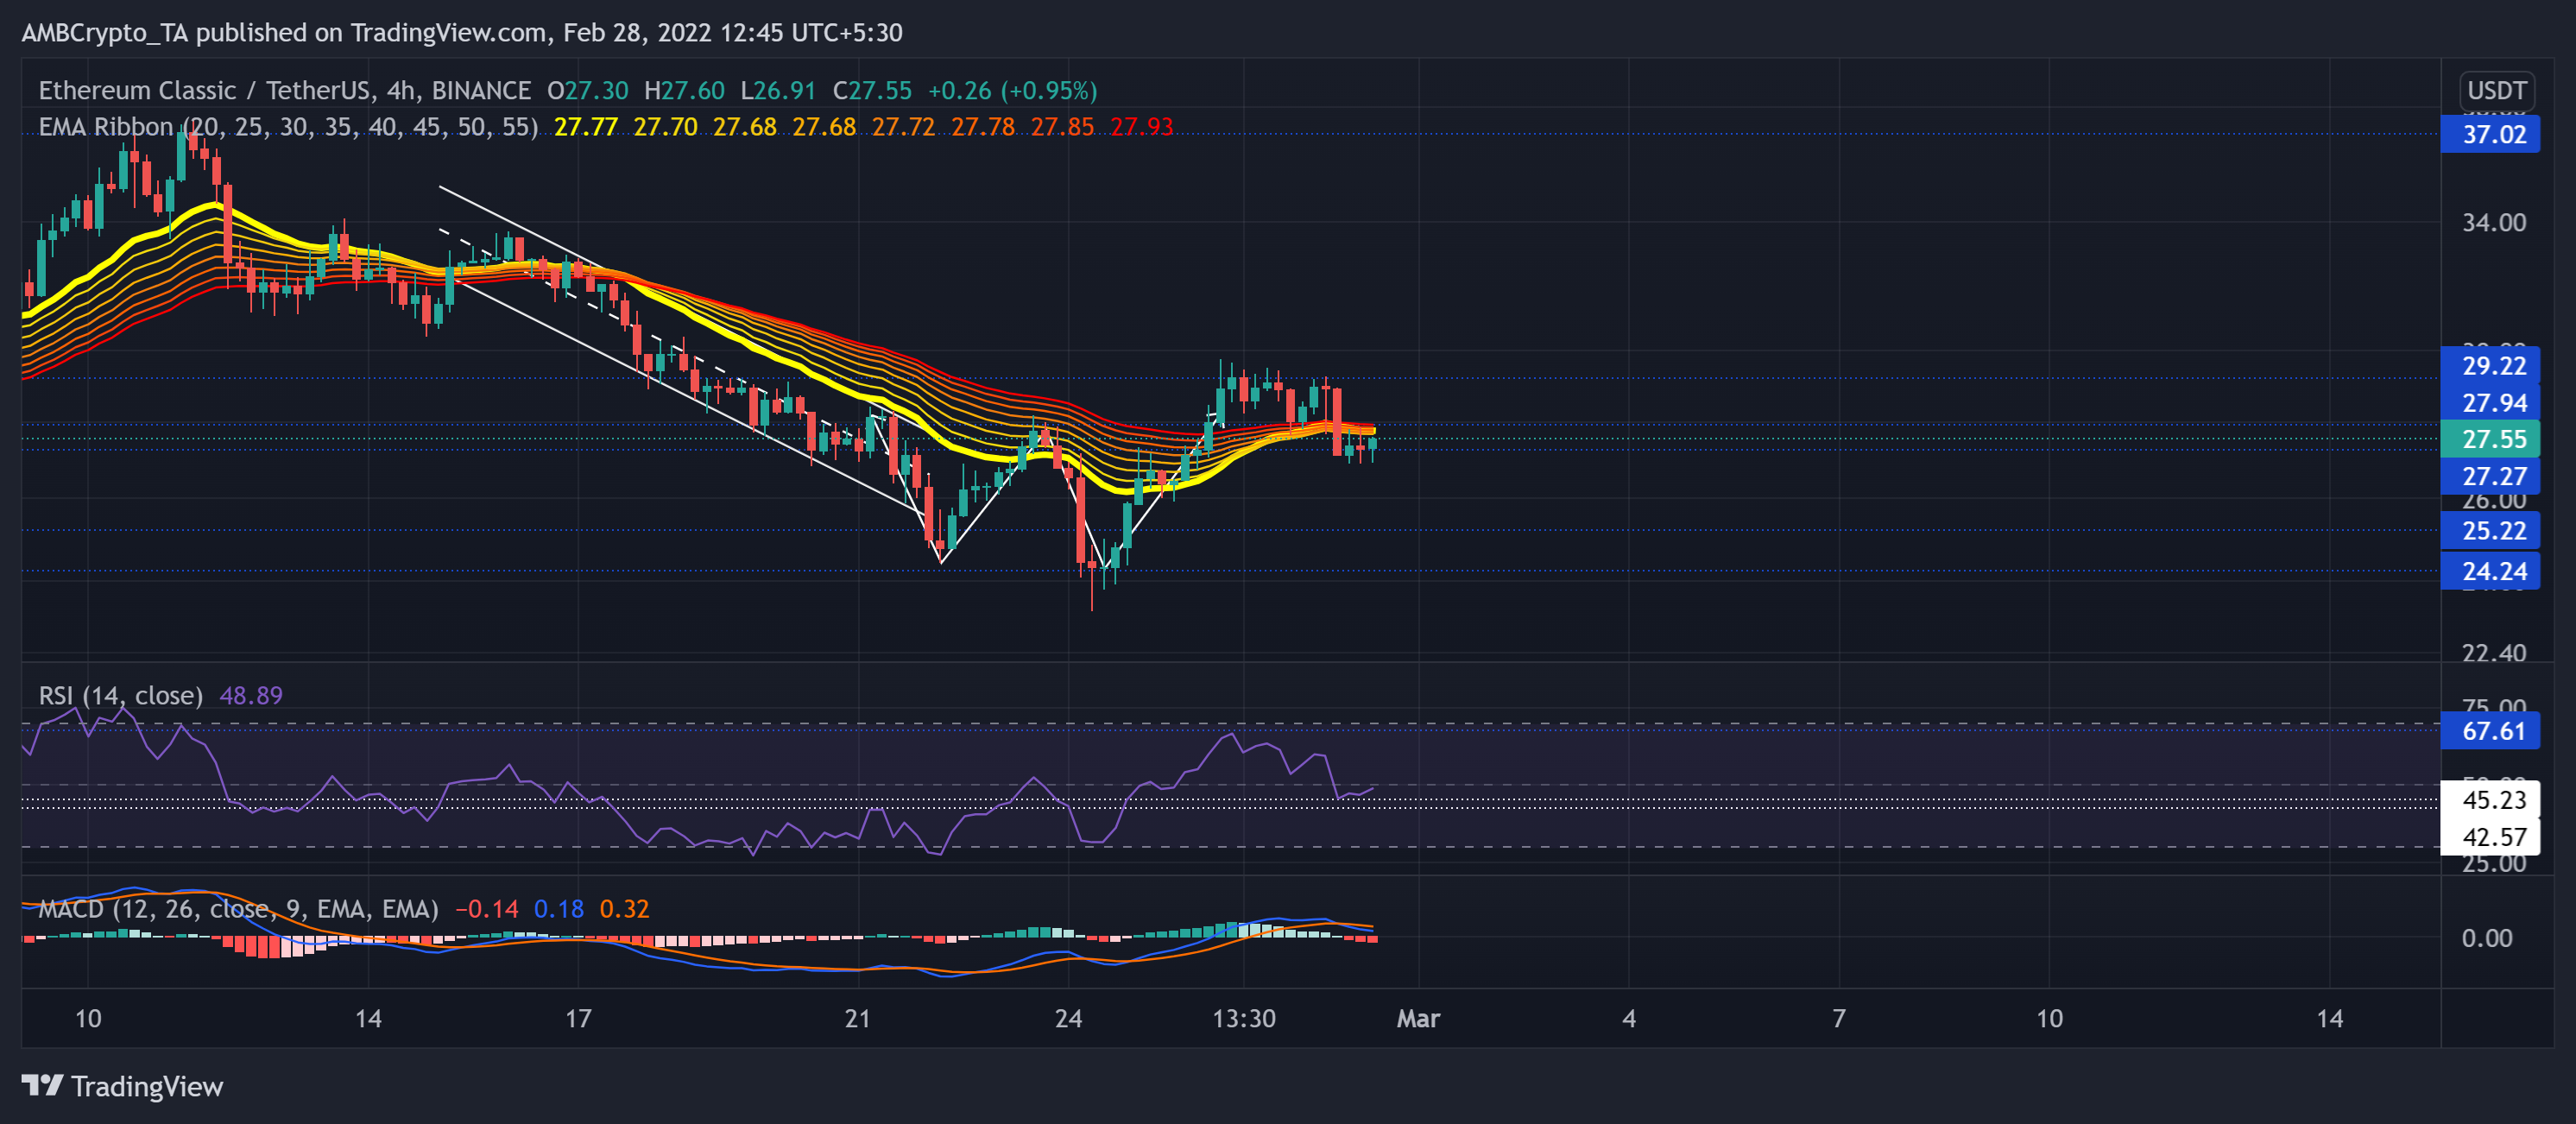
From its January lows, ETC registered a staggering 76.2% ROI and poked at the $37-resistance. Post which, it entered into the retracement phase. As a result, After an over 35% decline towards the $27-mark, the alt saw a double bottom on its 4-hour chart.
The breakout above the $27-level pushed ETC above its EMA ribbons but struggled to overturn the $29-resistance. Over the past day, the alt rejected higher prices while falling below the ribbons. But the bulls upheld the immediate support.
At press time, ETC traded at $27.55. Over the past 24-hours, the RSI reversed from the overbought region and fell below the midline on 27 February. While the 42-45 point support range stood sturdy, a possible recovery phase could reclaim the lost equilibrium. Also, the MACD histogram fell below the zero line while its lines also depicted a bearish edge.
EOS
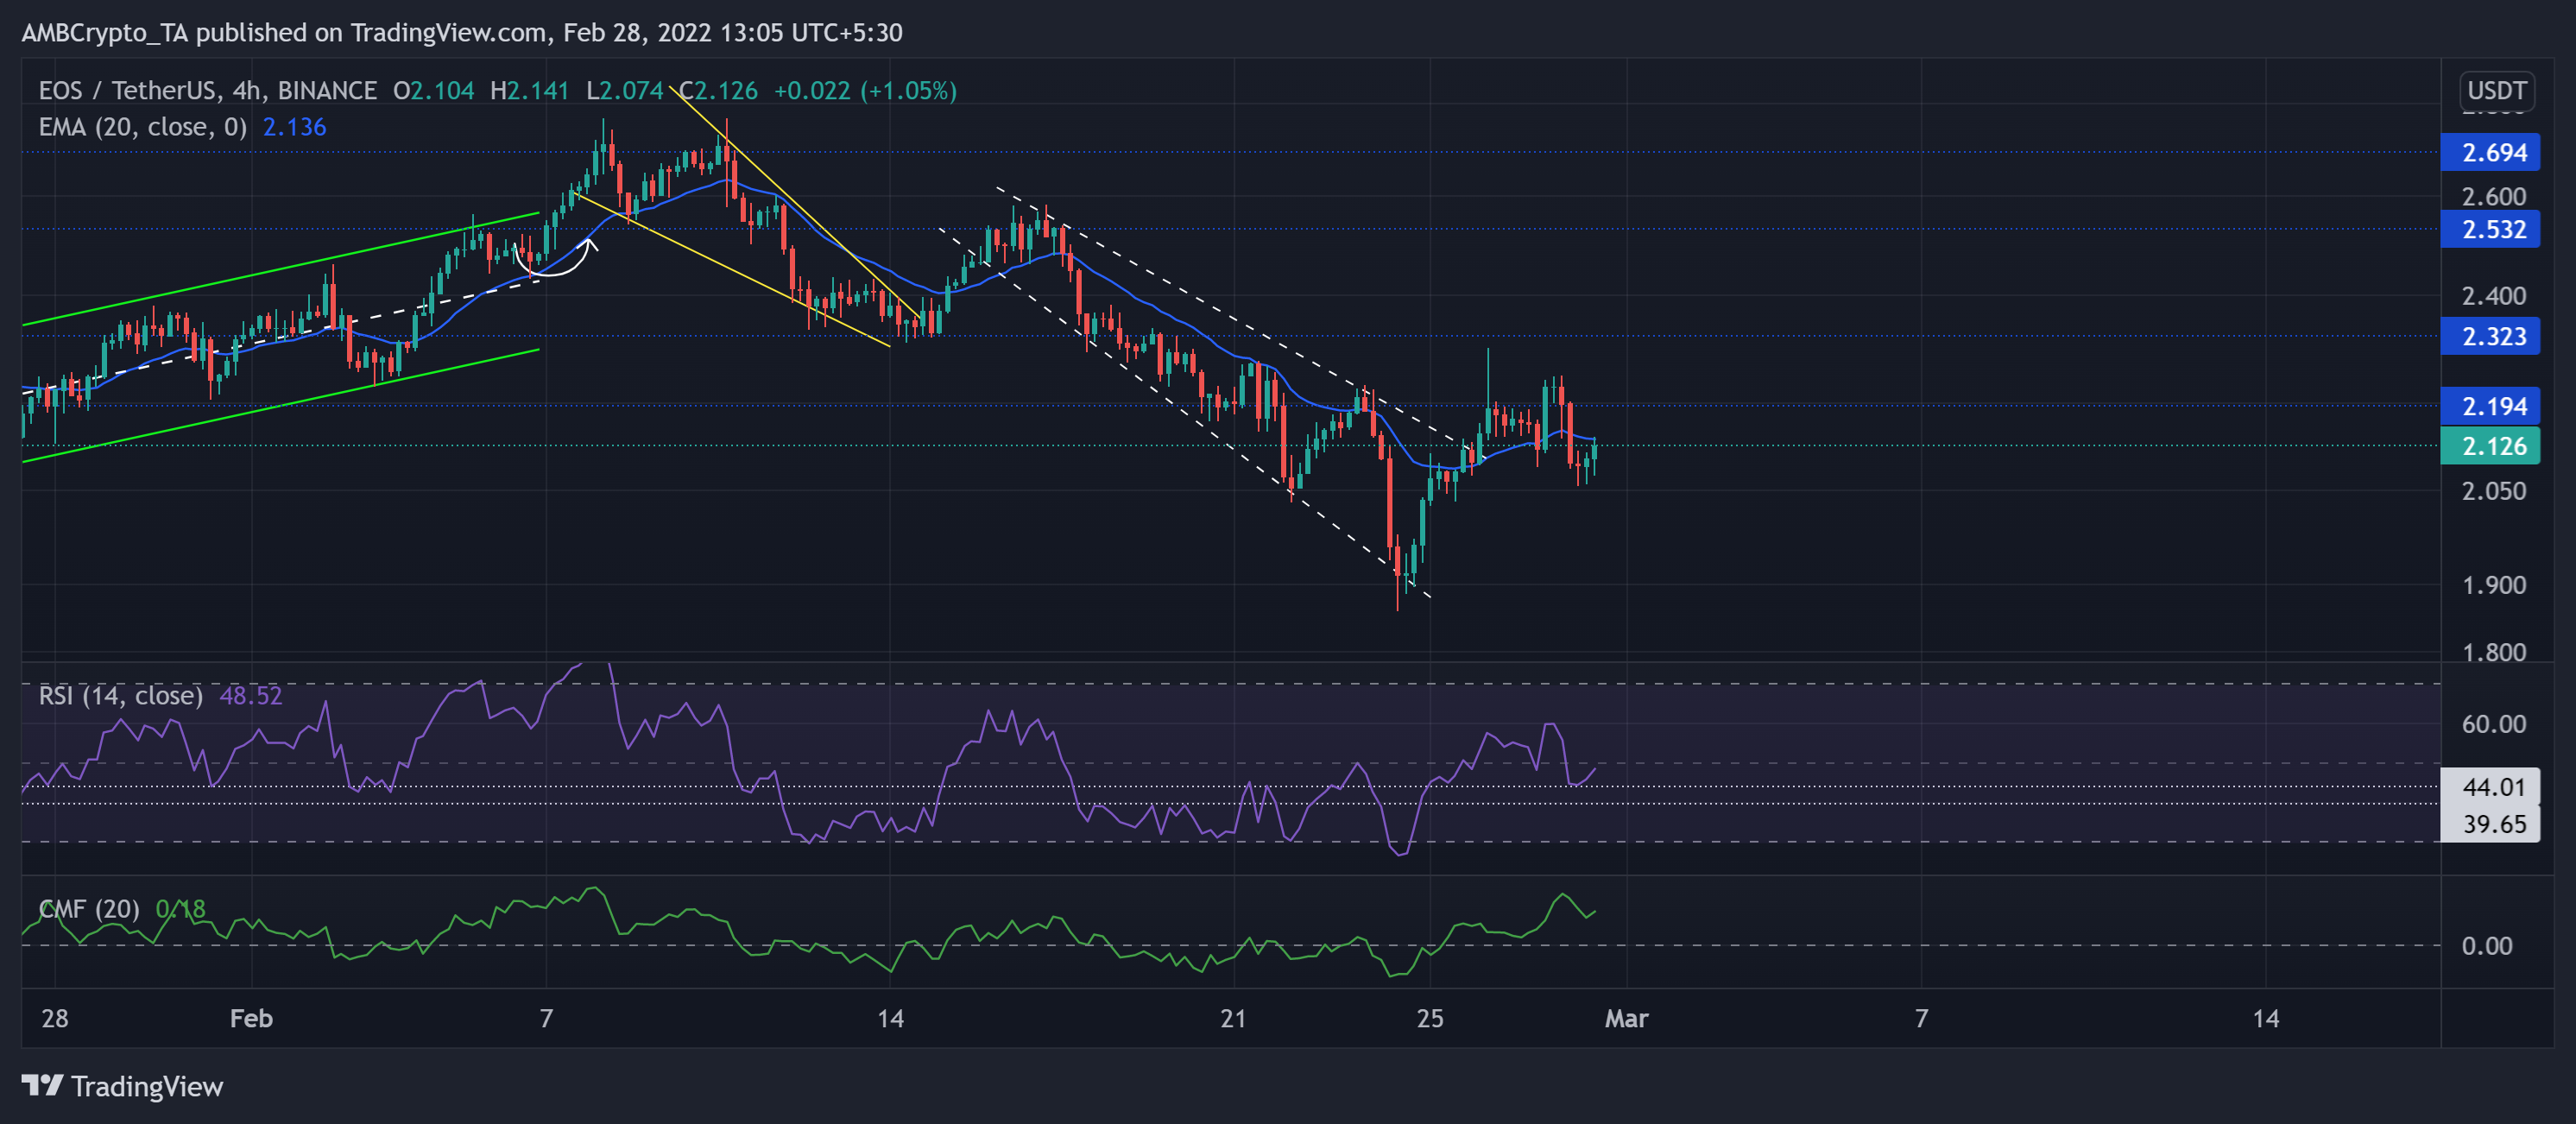
EOS saw an up-channel (green) incline of 40.2% until reversing from the $2.6-level. Over the last 18 days, it saw two reversal patterns on its 4-hour chart. The alt lost over 32% of its value (from 10 February) and hit its 23-month low on 24 February.
Now, the buyers aimed to reclaim the $2.19-mark while the bears continue to pose obstruction at the 20 EMA (blue).
At press time, EOS traded at $2.126. The RSI failed to float above 50 but the 44-support seemed to hold near-term pullbacks. Interestingly, the CMF found a strong close well above the zero-line, affirming a bullish edge.