


Bitcoin dipped briefly beneath the $39k mark but was quick to reverse on Monday and the trapped short positions fueled its bounce past $40k. This meant that the altcoin market also saw some temporary respite, even though the near-term outlook of many coins remained bearish. Tezos and Ethereum Classic appeared to have a strong zone of resistance to the north.
Tezos (XTZ)
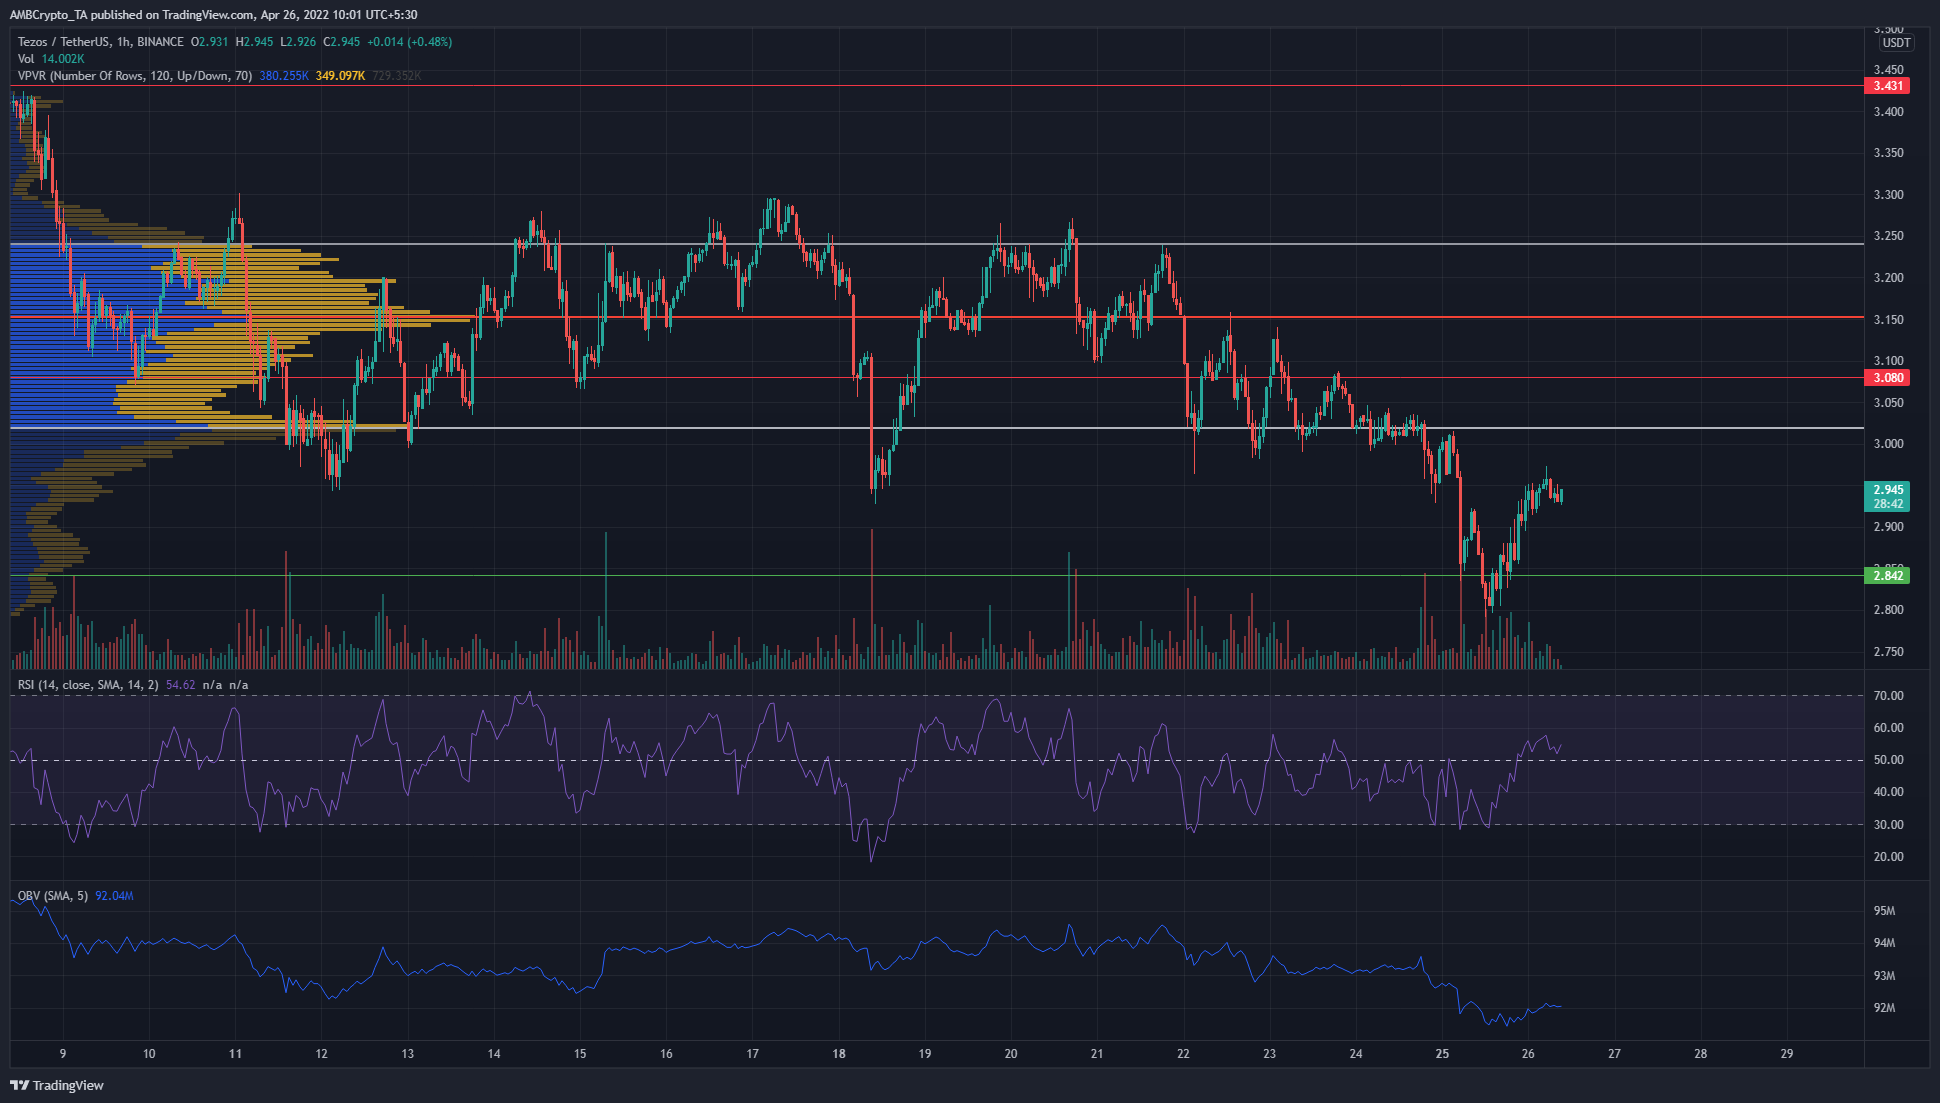
The Volume Profile Visible Range tool showed that the past two weeks of trading were mostly concentrated within the $3.02-$3.24 area. where the Value Area Lows and Value Area Highs lie respectively. At the same time, the OBV was also moving sideways, to indicate that neither buyers nor sellers were dominant overall. The Point of Control was at $3.15, and XTZ was trading beneath all of these important levels.
Even though the RSI climbed above neutral 50 to signal a shift in momentum away from the bearish side, the market structure remained bearish. The OBV was also plumbing new depths. This suggested that, unless XTZ can climb above $3.05, more downside remains likely.
Ethereum Classic (ETC)
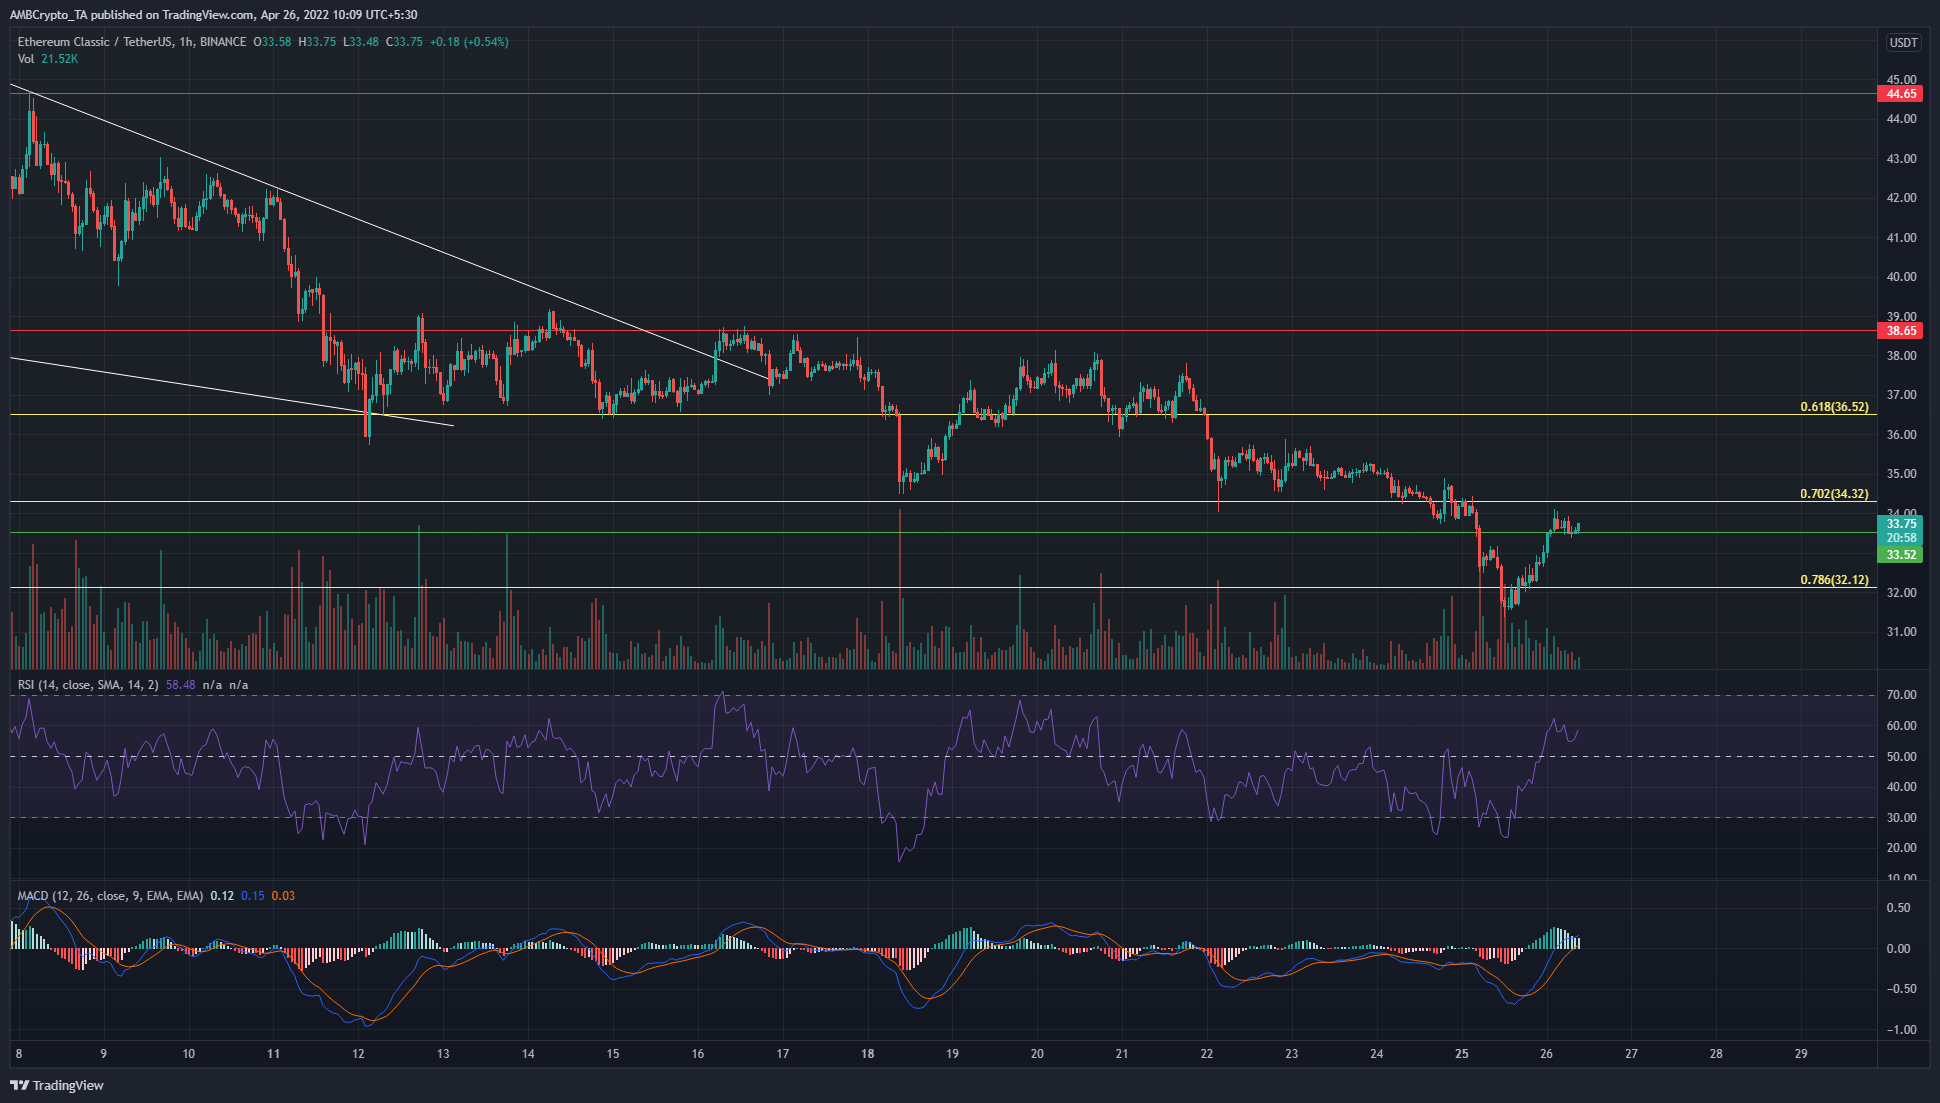
Based on the move from $26.52 to $52.7 in March, a set of Fibonacci retracement levels (yellow) was plotted. They showed that, despite the strong downtrend of ETC in the past two weeks, a bounce could be witnessed from the $32-$34 area.
In what looks to be a hunt for liquidity, ETC dipped below $32 to trigger short entries, before climbing back above the $33.5 level to trap the bears. To back this hypothesis of a shift in momentum, the RSI stood at 58 while the MACD formed a buy signal.
Caution is still advisable, as the $34.3 and $35 levels are strong resistances that could rebuff the bulls.
NEAR Protocol (NEAR)
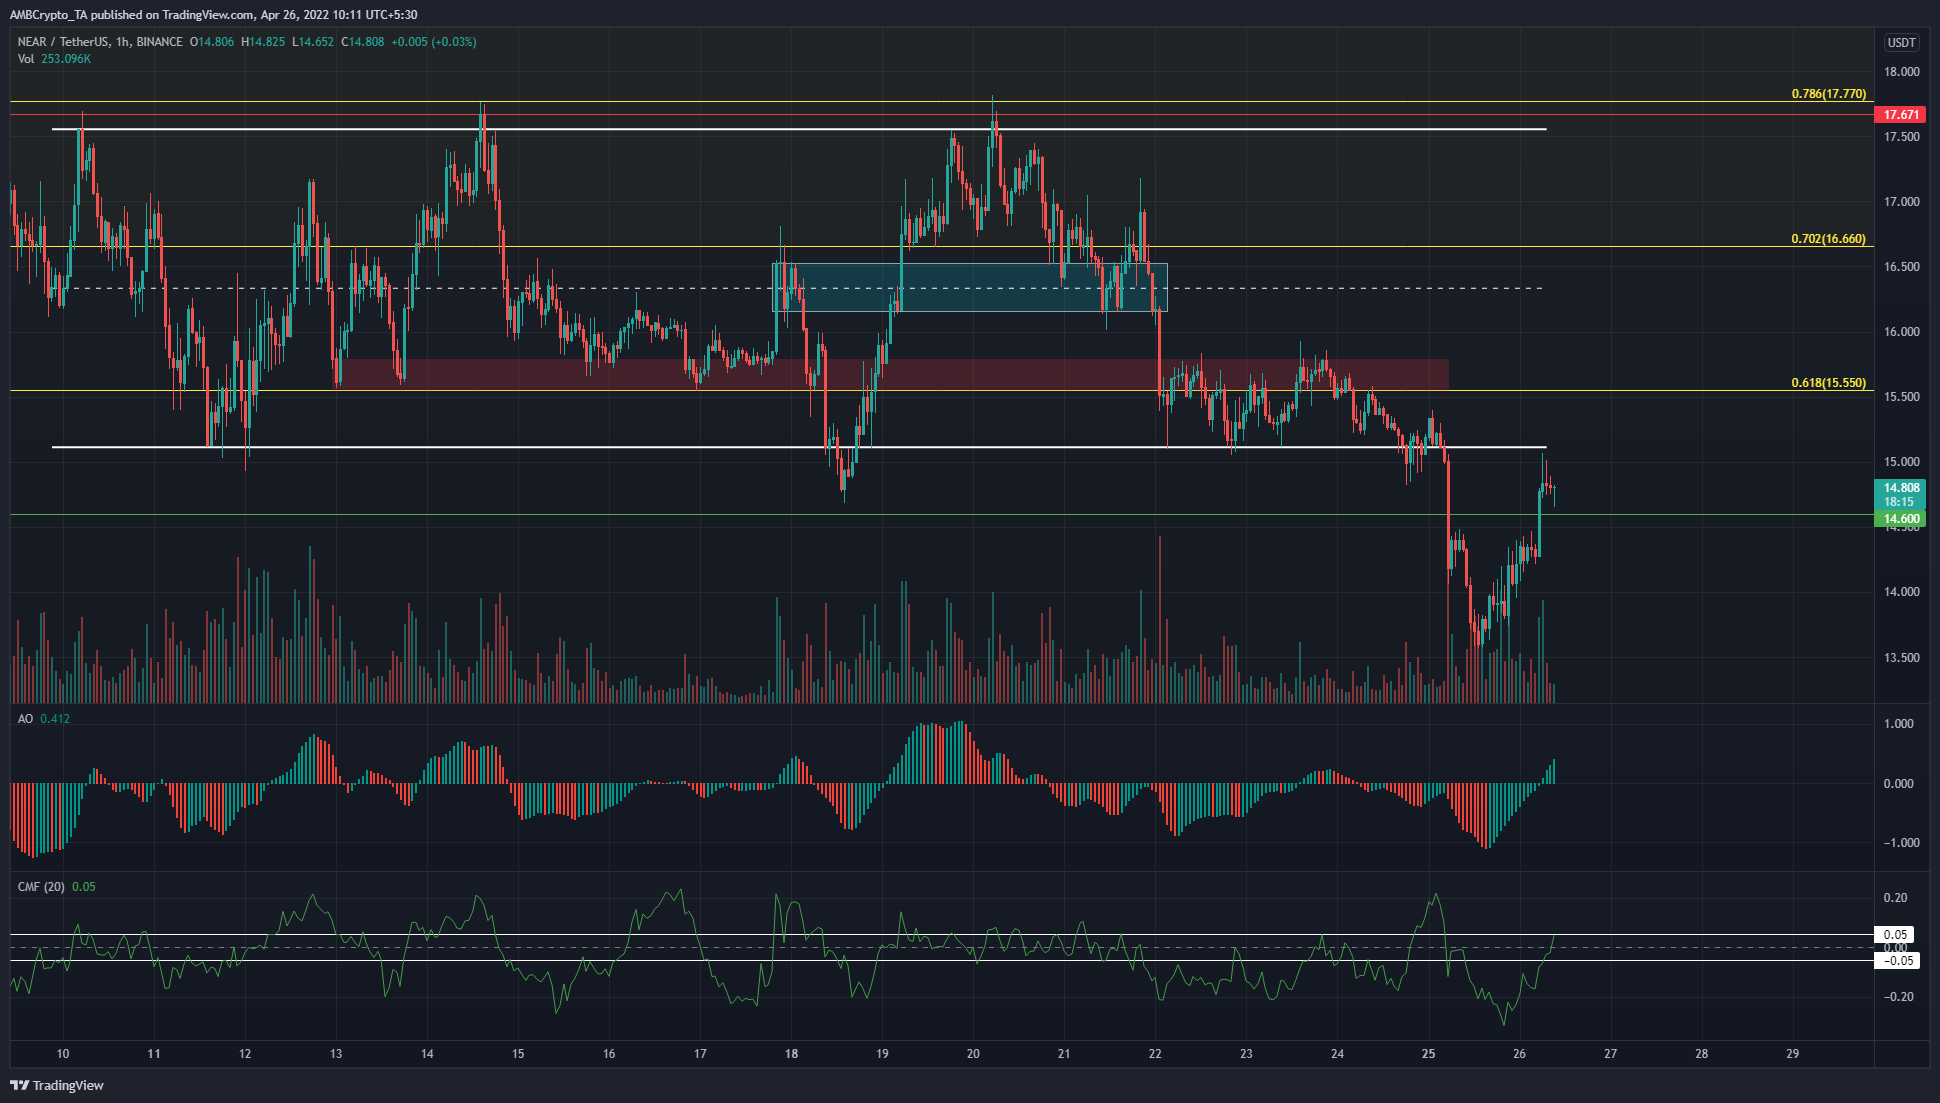
NEAR formed a range from $15.1 to $17.55, but in the past couple of days, the price fell decisively beneath the $15 zone. Moreover, this range was mostly a longer-term band of resistance for the price based on Fibonacci retracement levels (yellow). These levels were plotted based on NEAR’s down move from $20.6 to $7.38 in January.
Hence, the longer-term outlook has shifted bearish as NEAR faced rejection at the $17 area, and the short-term bias is also bearish based on just the price action. However, the hourly indicators reflected some bullishness from the bounce from $13.5.
The Awesome Oscillator climbed above the zero line, while the CMF also showed that there was a good amount of buying pressure behind NEAR.