Tezos may need more than mini-rallies to overturn a this trend

Tezos has been itching to break out of its parallel channel which lasted for almost the entirety of October. Over the last five days, bulls formulated two attacks on the upper trendline but sellers responded at certain resistance points, upholding XTZ’s larger downtrend.
With another lower low looking imminent, XTZ was expected to tag its lower trendline once again before a breakout. At the time of writing, XTZ traded at $6.44 with a market cap of $5.6 Billion.
Tezos 4-hour Chart
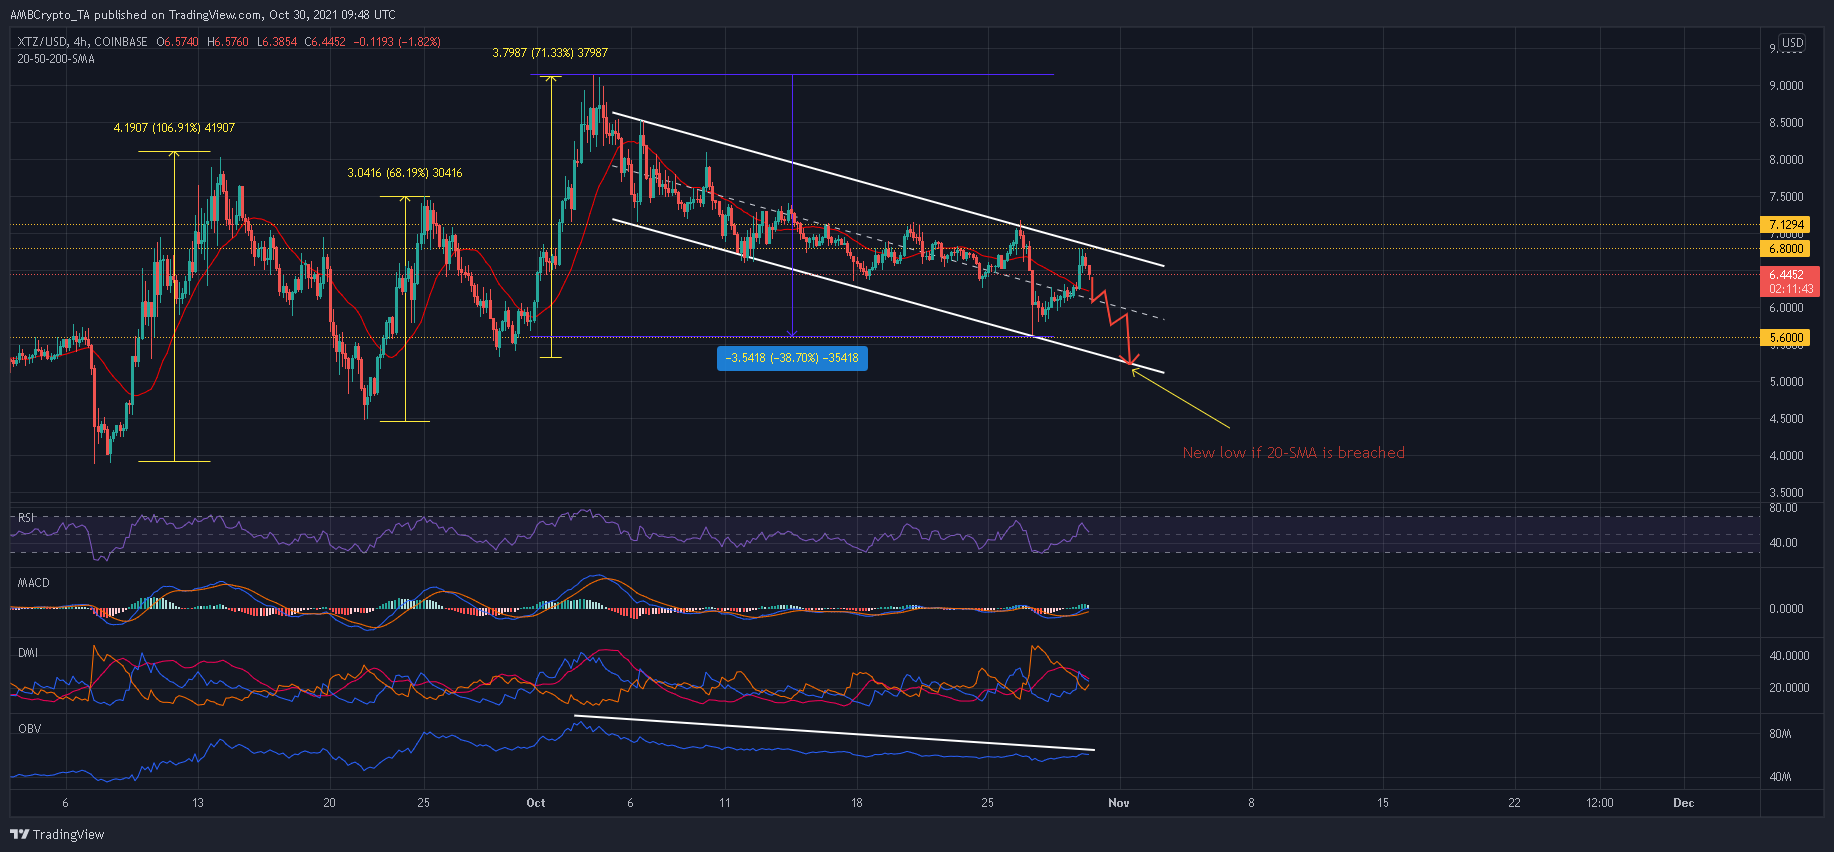
XTZ’s recovery post multiple false crashes during September has been quite impressive. The alt registered rallies of 107%, 68% during September, and finally, 71% heading into the first week of October. Since then, a deleterious down-channel has impaired XTZ’s outlook.
A series of lower highs and lower lows has seen XTZ erase nearly 40% of its value from its local high of $9.14. The On Balance Volume’s trajectory indicated that selling pressure has trumped buying pressure during this period.
In response, bulls have attempted to challenge this downtrend by attempting two breakouts over the past five days, but resistance levels at $7.13 and $6.82 has deranged such attempts. Considering a yet-to-recover MACD and a potential bearish crossover on the DMI, XTZ was expecting additional losses.
Should the price rebound from the 20-SMA (red) and mid-line of the channel, another high can be expected at the upper trendline around $6.7. On the flip side, a new low can between $5.3-$5.4 was likely in case XTZ weakens below the aforementioned confluence. A support region around $5 can offer an early pushback should bears enforce a breakdown from the pattern.
Reasoning
Despite recent gains, XTZ’s MACD has remained below the half-line for a period of 20 days. This weakness would continue to haunt XTZ by exposing it to short-sellers. A potential bearish crossover along the Directional Movement Index did sit favorably for bullish traders either. However, the RSI’s movement would induce some optimism, should it keep above the half-line.
Conclusion
Mini rallies towards the upper trendline have not resulted in a breakout just yet and XTZ needed to gather larger numbers to break away from its downtrend. The next few sessions could see XTZ dip towards its 20-SMA (red) should the MACD and DMI continue to flash bearish readings. In case XTZ cuts below its near-term moving average line, a new low was anticipated between $5.3-$5.4.


