
Bitcoin and Ethereum slowly started to reverse their losses, however, altcoins saw some independent movement on the charts. Tezos climbed by 2% while Monero traded below its $257.25 support level. Finally, NEM recorded sideways movement on its own price chart.
Tezos [XTZ]
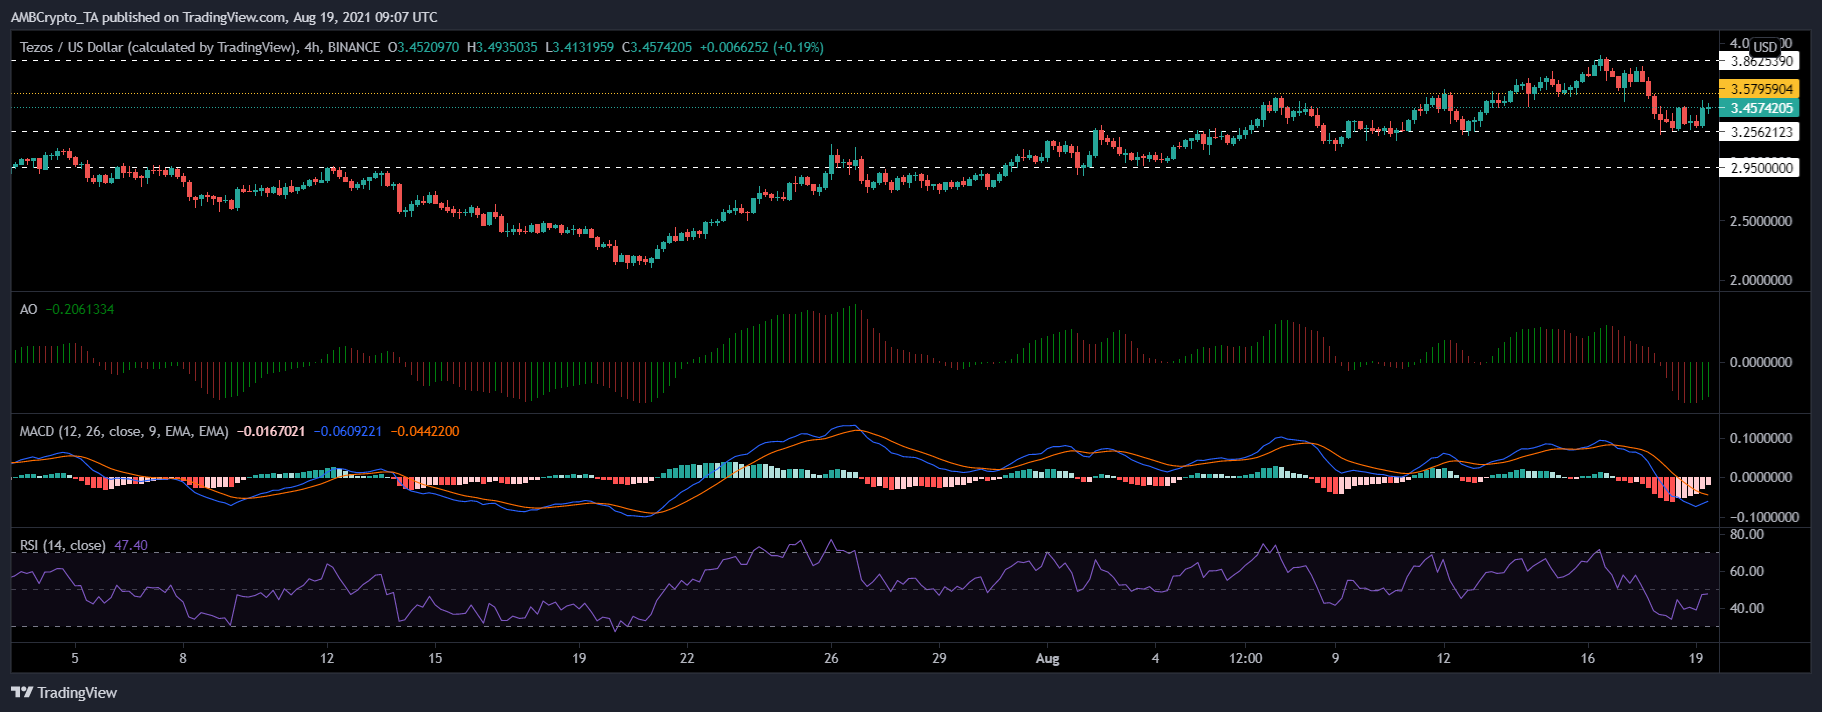
XTZ/USD, TradingView
XTZ reversed some of its recent losses as it climbed up by 2% over the last 24 hours. It bounced off the $3.25 support level as the alt was priced at $3.45. XTZ eyed the immediate resistance level of $3.57. Technicals emanated mixed signals for Tezos.
Buying pressure had recovered as the Relative Strength Index moved up near the 40-mark. The Awesome Oscillator flashed green signal bars validating the aforementioned statement about buying pressure recovering.
While the MACD kept displaying red histograms, the same was receding over the past few sessions.
In case the price remains around the said level over the next few trading sessions, XTZ could land on $3.25 and then touch $2.95.
Monero [XMR]
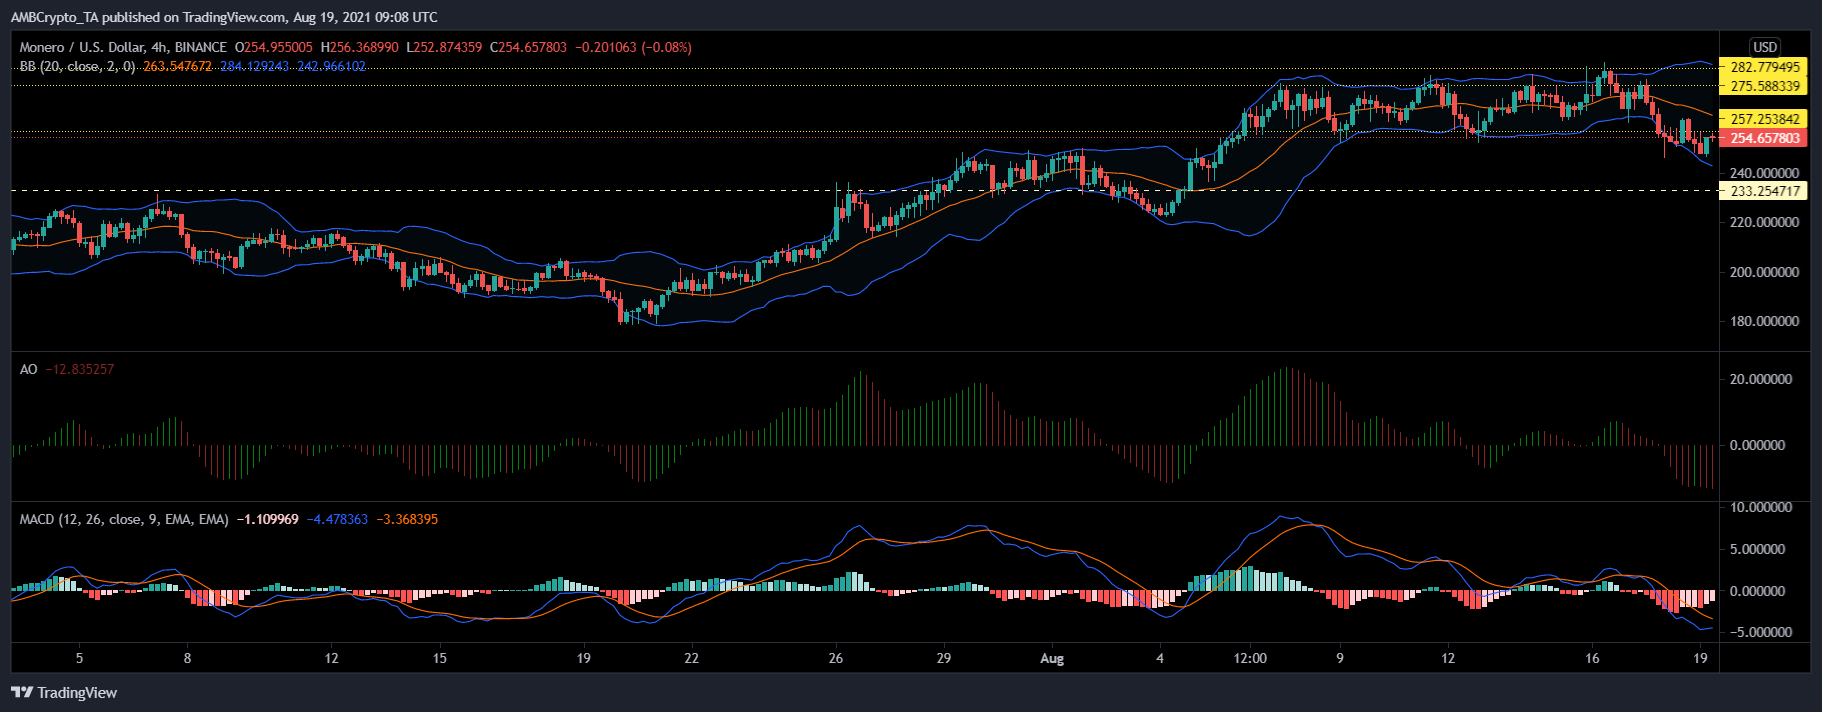
XMR/USD, TradingView
XMR dipped by 1.7% over the last 24 hours as it cut below its support level of $257.25. The altcoin was trading at $254.65. With a sustained downtrend, the next support level for the alt lay at $233.25. The indicators flashed bearish price signals for the coin on the four-hour trading chart.
The Awesome Oscillator observed red signal bars implying a downtrend in price. In accordance with the same, the MACD also displayed red histograms, albeit declining ones.
The Bollinger Bands noted sharp divergence which signified that market volatility could increase over the coming trading sessions.
In case of an uptrend, XMR can test $275.58 for the fourth time in the same month.
NEM
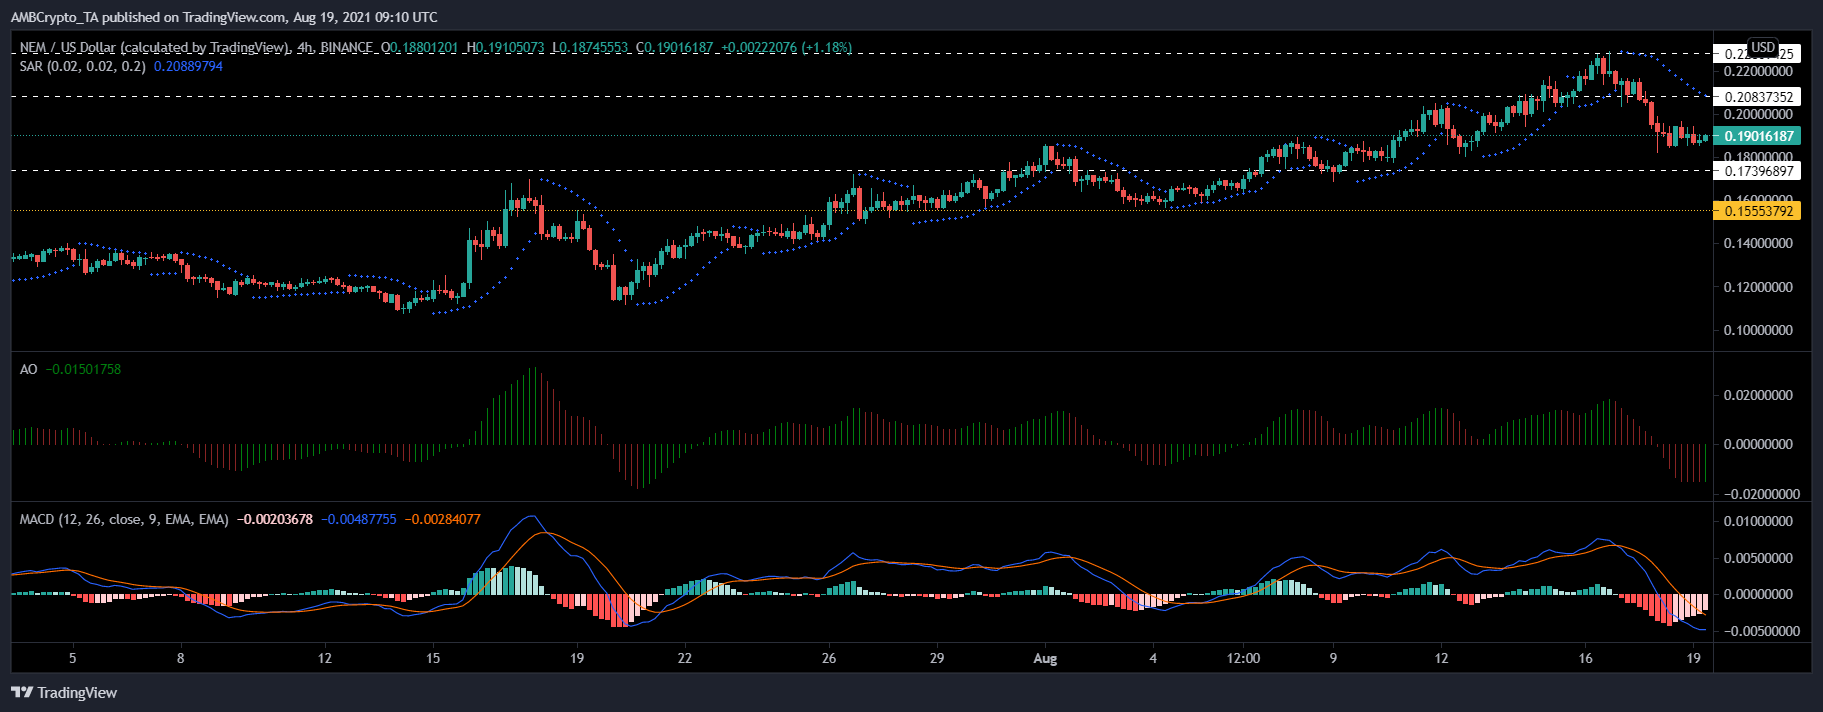
XEM/USD, TradingView
XEM had started to register sideways movement as the coin only dipped by 0.9% over the last 24 hours. The token was priced at $0.190, however, with a hike in selling pressure, it could trade near its immediate support level of $0.173.
The Awesome Oscillator flashed mixed signals. However, the indicator displayed a majority of red signal bars, implying that the bears were still in charge of the prices. The Parabolic SAR also indicated a downtrend with dotted lines aligned over the candlesticks.
Finally, the MACD observed red histograms although they were losing strength as the indicator approached a bullish crossover.
If the alt breaks its consolidation and moves up north, the resistance levels would lie at $0.208 and $0.224.