


Tezos broke above the 0.5 Fibonacci level and targeted the 0.618 and 1-levels on the back of its bullish on-chain metrics. Further down the crypto-ladder, Synthetix positioned itself for additional gains after its price regained the $20-mark. Finally, Verge was projected to move within an ascending channel, especially since it seemed to lack volumes for a breakout in either direction.
Tezos [XTZ]
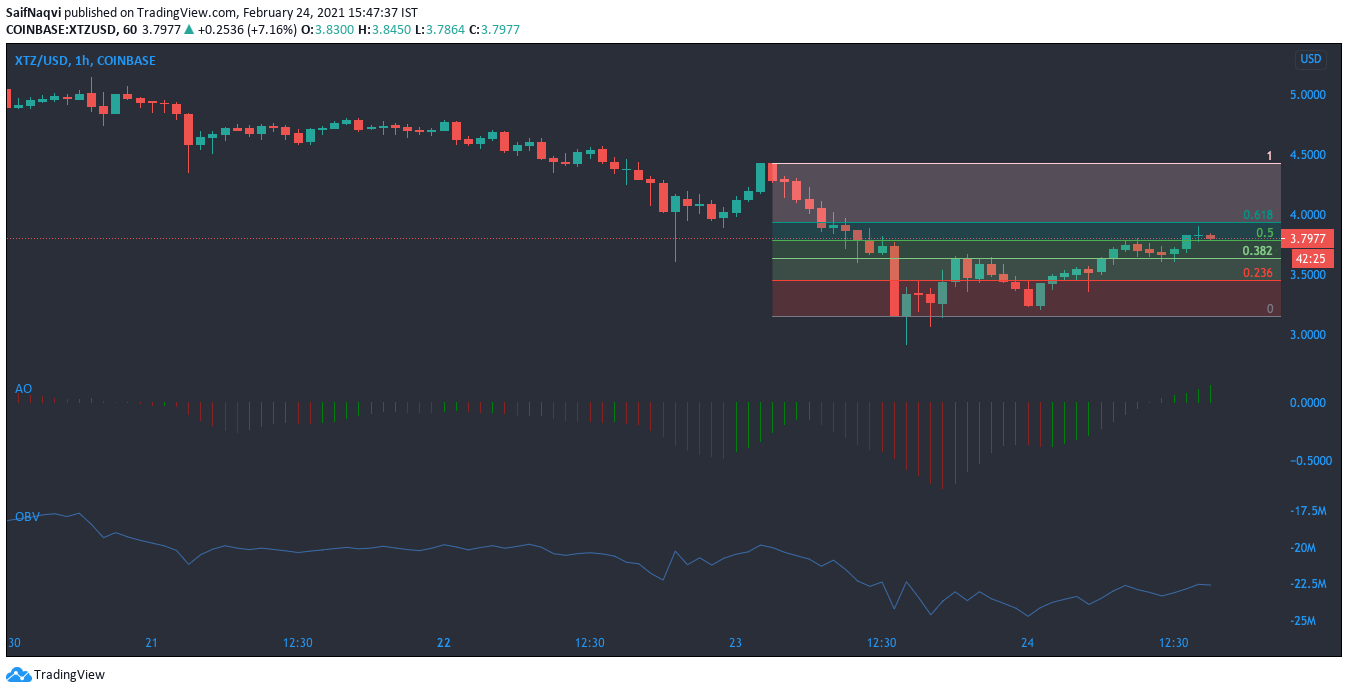
The swing high and swing low points at $4.14 and $3.14, respectively, on Tezos’s hourly chart, were used to point out important Fibonacci levels. At the time of writing, the crypto’s price had broken above the 0.5 level as the indicators flashed bullish signals. What remains to be seen, however, is if the aforementioned level would hold up in the event of a pullback in the broader market.
The Awesome Oscillator moved above the half-line, while the OBV registered an uptick as buying pressure was on the up. An extended bullish scenario would present the next resistance levels at $3.93 (0.618 fib level) and $4.4 (1 fib level).
Synthetix [SNX]
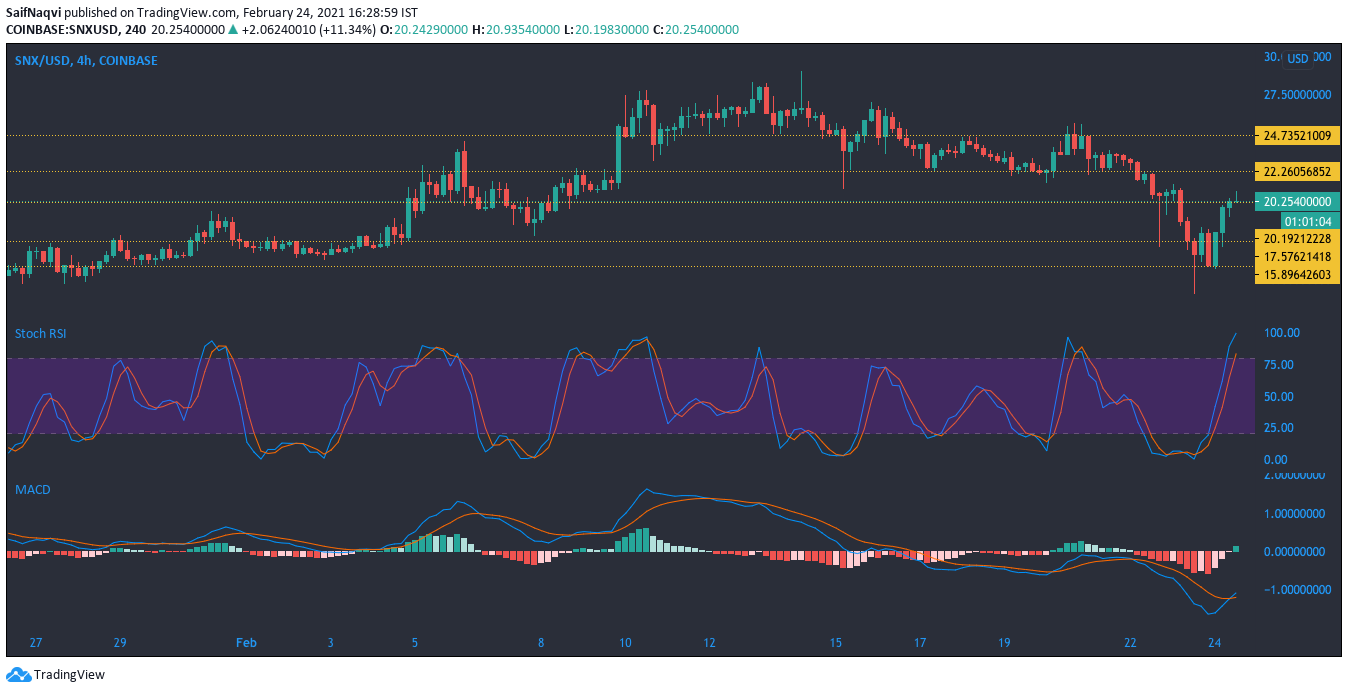
Synthetix formed long bullish candlesticks on its 4-hour chart as the crypto’s price rose by over 25% after bouncing back from the $15.9-support level. Even though the Stochastic RSI moved into the overbought zone, it was pointing north and alluded to a delayed reversal. In fact, SNX could be poised for additional gains if the bulls maintain the price above the pivotal mark of $20.
A bullish crossover in the MACD also increased the likelihood of a favorable outcome. The overhead resistance levels lay at $22.26 and $24.7.
Verge [XVG]
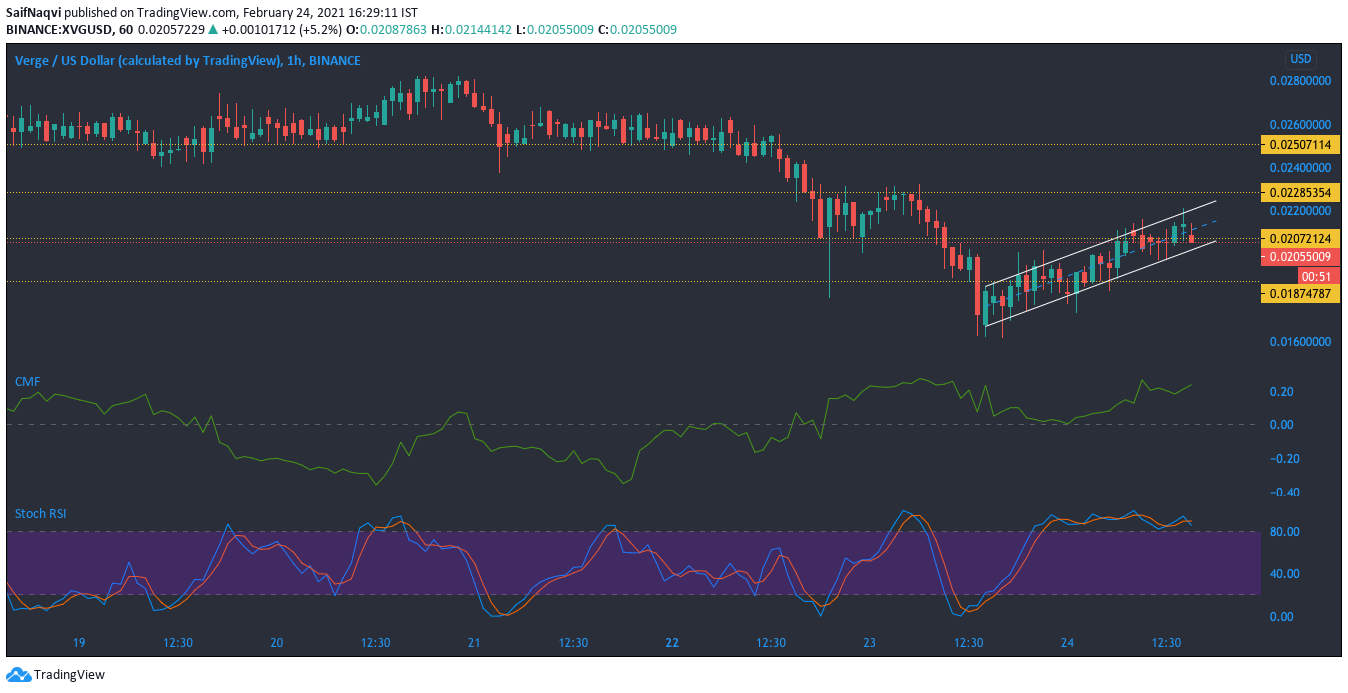
On the hourly chart, Verge moved within a parallel ascending channel after moving north from its $0.016-support. The Chaikin Money Flow registered a spike as capital inflows were strong for the cryptocurrency’s market. However, a northbound breakout seemed unlikely as trading volumes remained muted.
In fact, the Stochastic RSI underlined an oversaturation of buyers in the market as the index traded in the upper region. The extent of the reversal would determine whether Verge can break south from the pattern. A bearish scenario would see the price move downwards and towards the $0.018-support.